chart

Napkin

Napkin

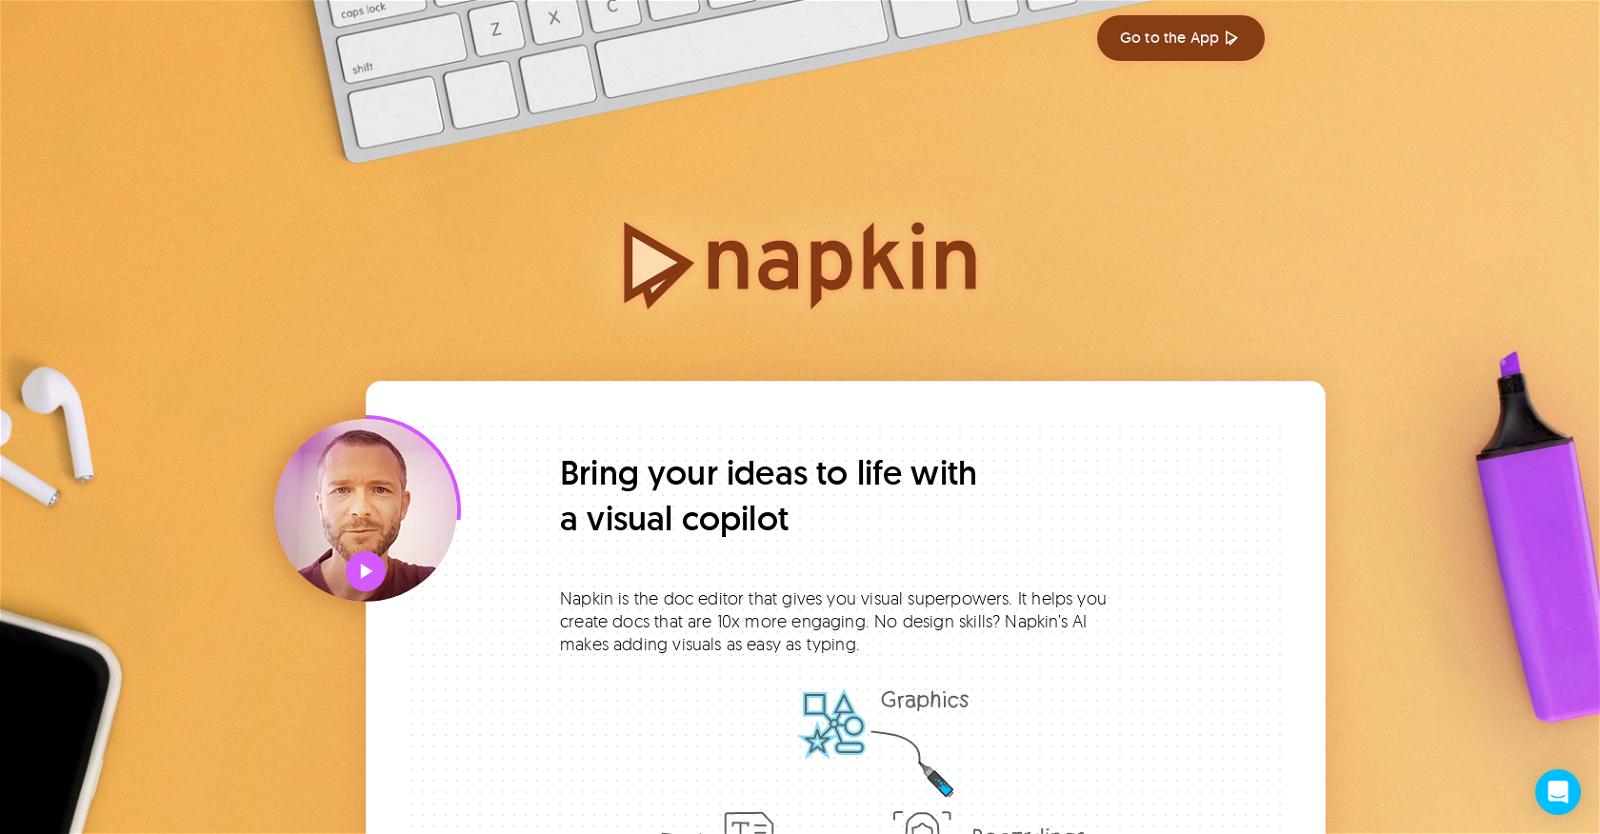
Napkin AI is a doc editor that helps users create engaging documents with visual aids and storytelling elements. Its AI features enable users to add icons, drawings, charts, and diagrams to their content easily, without the need for design skills.

The tool provides visual suggestions based on context and facilitates collaboration by allowing easy sharing of created documents. It offers a unique feature where users can record short videos inline with their content, enabling easy storytelling and presentation of ideas. The videos are automatically animated, making them more engaging without the need for further editing.

Napkin AI simplifies the editing process, allowing users to remove unnecessary filler words and noises with ease. It is marketed as a visual copilot, indicating that it works as a supportive tool for users to bring their ideas to life. Its user-friendly interface and intuitive features make it accessible to users of all levels of expertise.

Overall, Napkin AI is a recommended tool for anyone looking to improve the engagement and visual appeal of their documents, presentation, or storytelling.

Chartify

Chartify

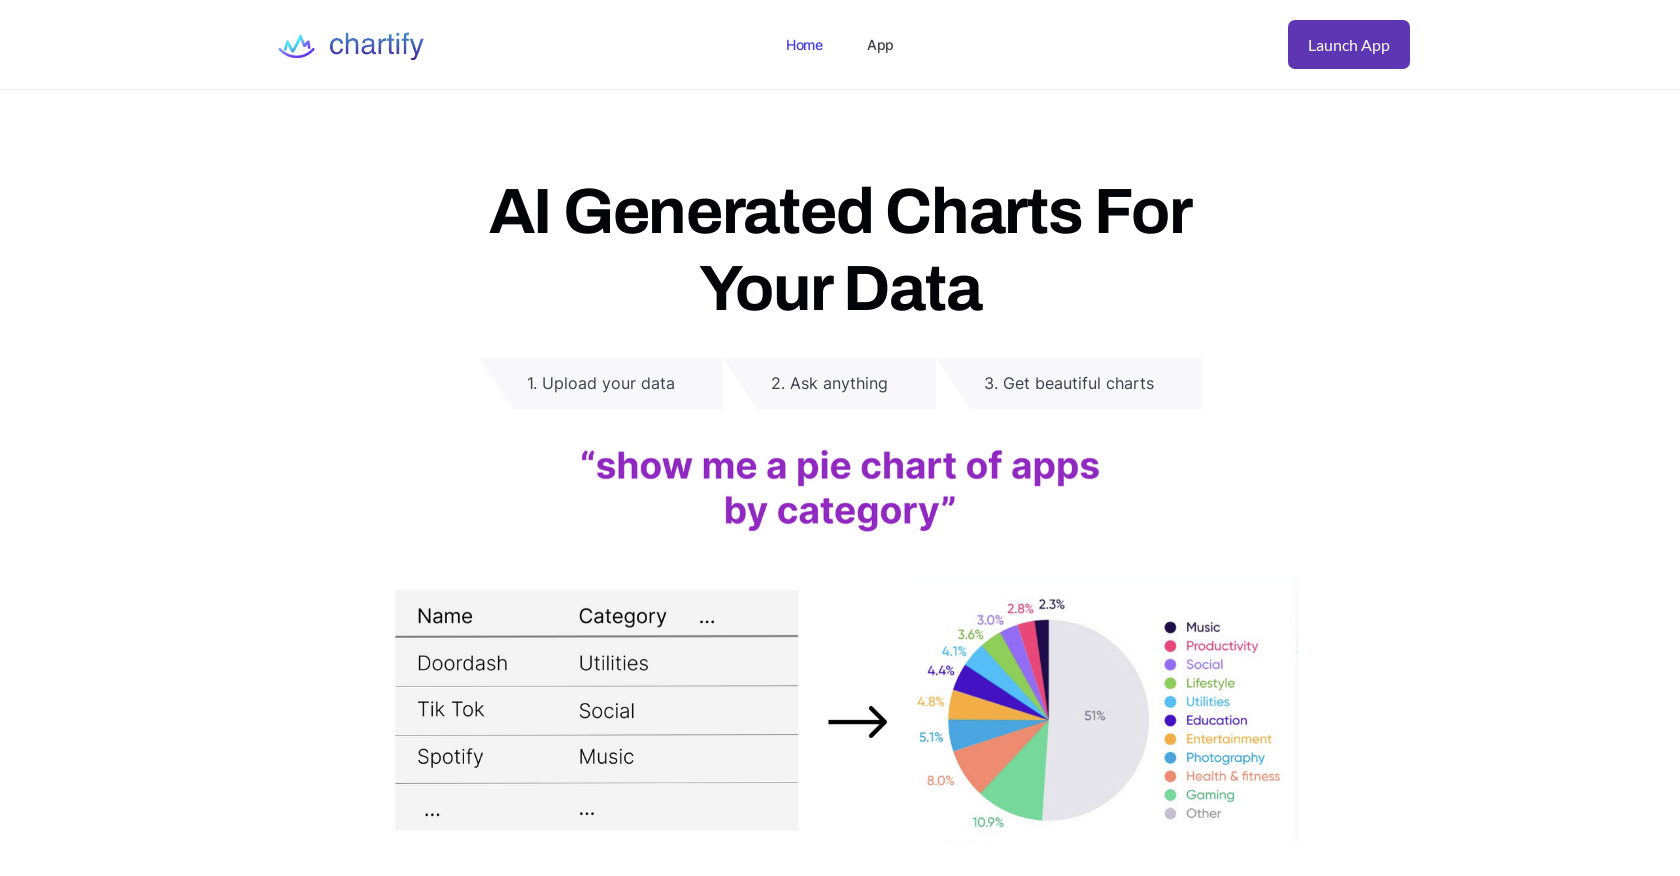
Chartify is an AI-powered tool that assists in generating interactive charts and graphs from CSVs and database tables. With Chartify, users can upload their data, and the AI will recommend a variety of visualizations, including pie charts, bar charts, and line graphs. Users can also request their preferred chart types, and the AI will generate beautiful charts across Plotly, Matplotlib, Seaborn, and Charts.js.

Chartify eliminates the need for manually coding up charts in Plotly or using frustrating chart editors in Google Sheets and Excel. Chartify welcomes users to upload their data via CSV, Postgres, or MySQL. The AI tool will suggest recommended visualizations right away, based on the data provided. Users can ask for a specific chart type, and the AI will provide various options and styles.

Chartify’s intuitive interface provides an entirely new way to interact with data, and users can explore data from all angles by using a variety of visualizations. Overall, Chartify is an excellent tool for anyone looking to quickly generate engaging and data-driven insights.

ChartGPT

ChartGPT

CHARTGPT is an AI tool that automates the process of creating charts from text inputs. The software takes in a description of your data and creates visually appealing charts using React, Next.js, OpenAI, and Tailwind CSS.

The user inputs data in the form of text, and the tool converts it into a graph, saving users a great deal of time and effort. It is ideal for those who need quick visualizations of data, such as presenters, data analysts, and researchers.

The use of OpenAI ensures that the charts generated by CHARTGPT are accurate and that the tool can understand complex and unstructured data inputs. The output is presented in a beautiful format, making it easy to understand and share with others.

Based on its description, the tool appears to have a user-friendly interface and is easy to set up. It is available on GitHub, which is a plus for developers who want to integrate the tool with their existing projects.

Overall, CHARTGPT is a useful tool for creating beautiful charts quickly and efficiently, making it a valuable addition to any data analyst or researcher’s toolkit.

Chat2CSV

Chat2CSV

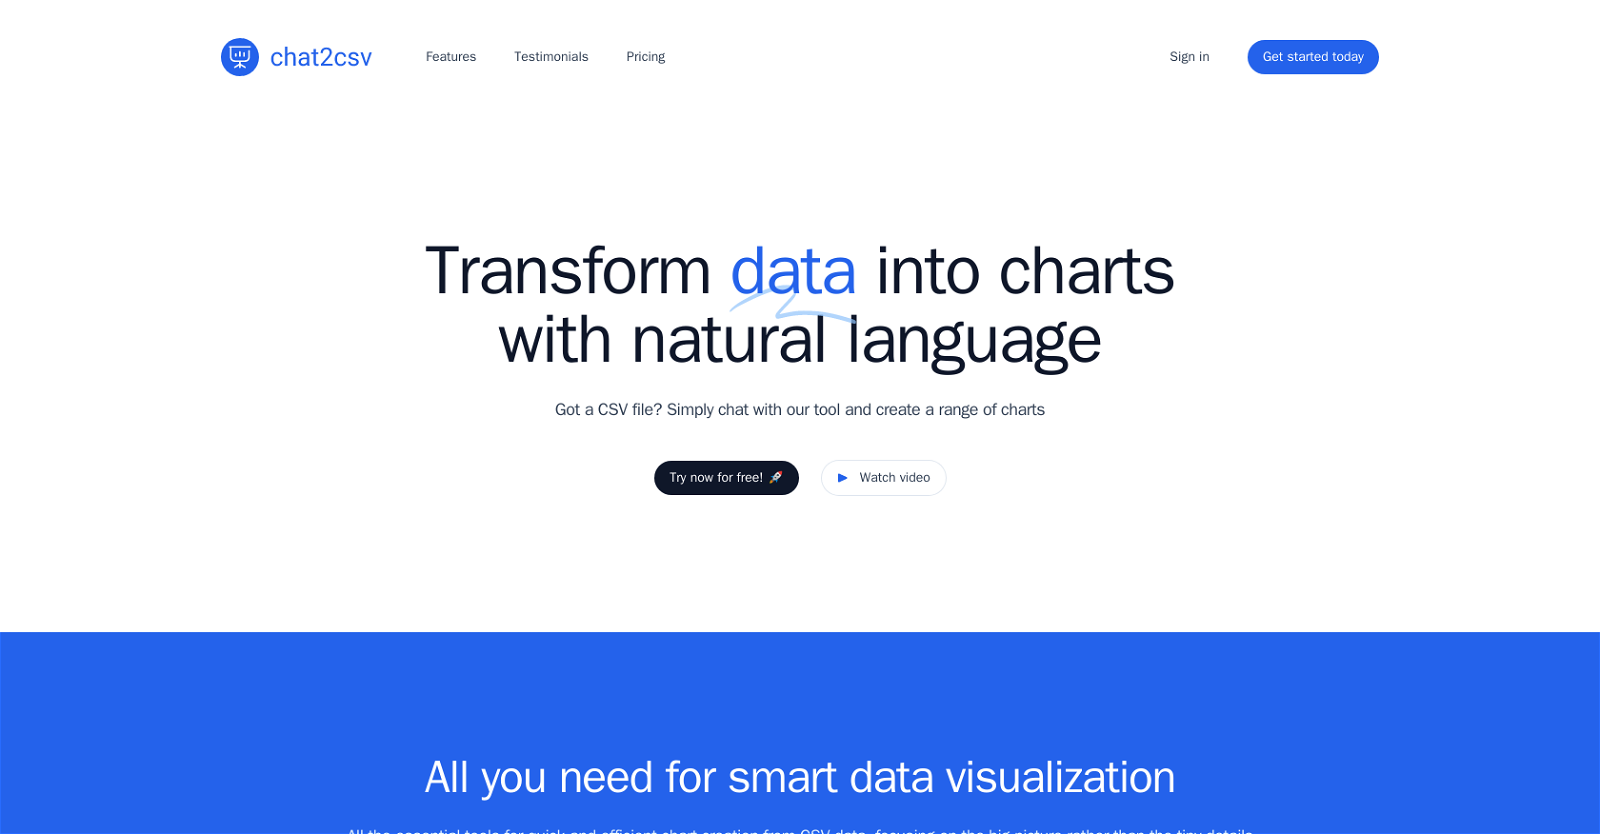
Chat2CSV is a data visualization tool that allows users to transform CSV files into various types of charts using natural language commands. With an emphasis on simplicity and efficiency, the platform eliminates the need for complex coding or scripting.

Users can provide instructions in plain English, such as “create a bar chart of sales by region,” and the tool will generate the desired visualization. The platform’s AI support not only understands user commands but also provides suggestions on the most suitable charts for data analysis, enhancing insights and analysis.

With a wide variety of chart types available, including pie charts, scatter plots, line graphs, and bar charts, users can effectively visualize their data. Data security is a priority for Chat2CSV. The platform’s servers only process metadata, ensuring that the actual data remains on the user’s side, guaranteeing privacy and data security.

Free access to the platform is available, allowing users to explore its features with minor limitations. A premium plan is also coming soon, offering increased query limits, the ability to work with multiple CSV files, larger file size limits, and cloud storage.

Users have praised the platform for its intuitive interface and ease of use, with the AI assistant providing valuable suggestions for chart types and transforming data analysis into an enjoyable experience.

ChartGPT Cadlabs

ChartGPT Cadlabs

ChartGPT Cadlabs Overview:

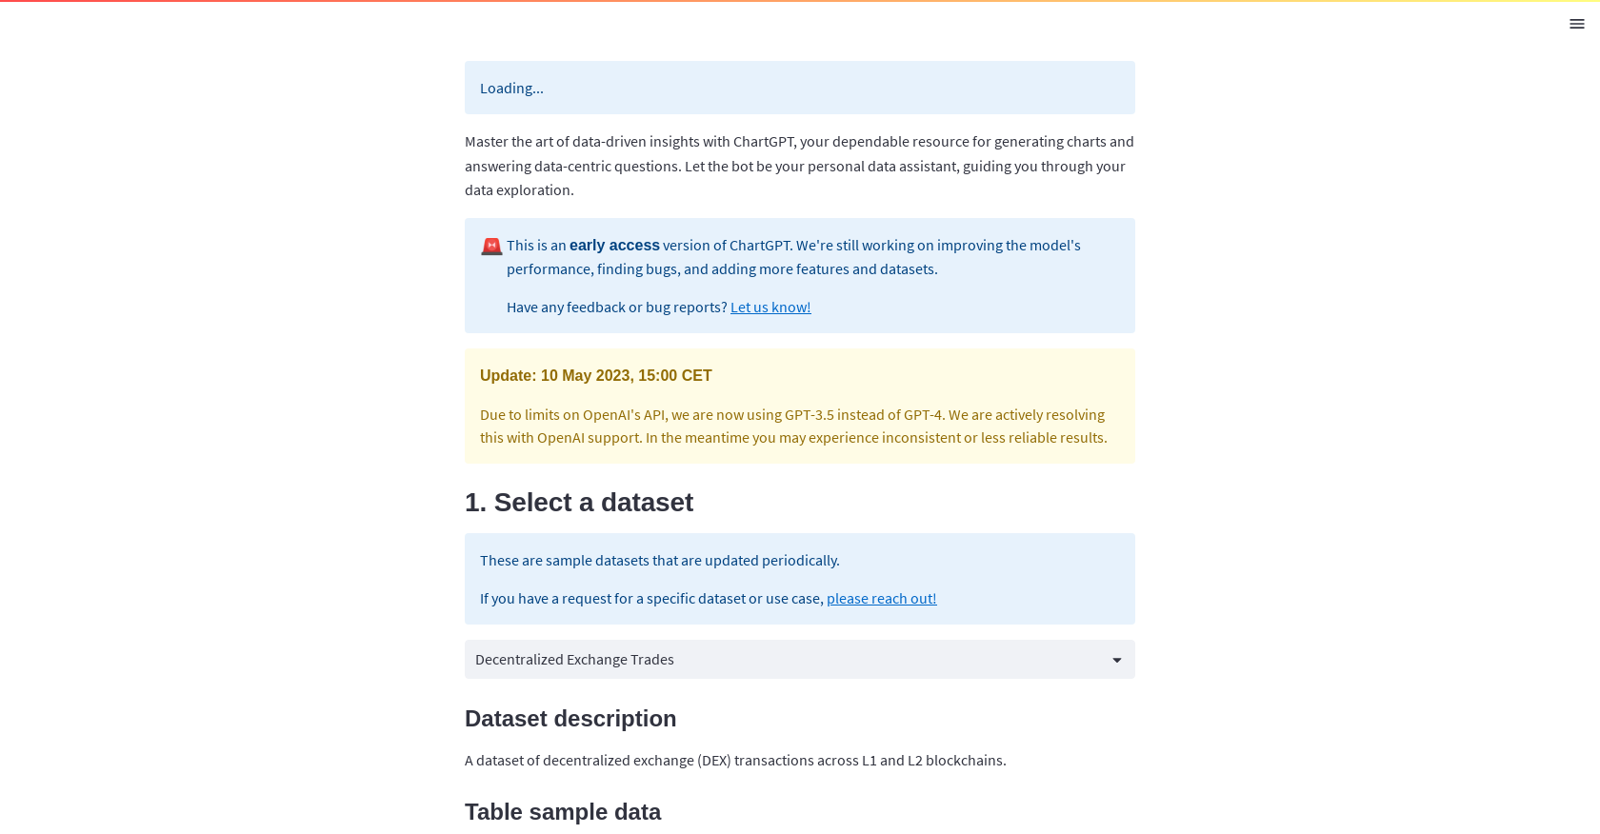
ChartGPT Cadlabs is an AI tool designed to generate charts and provide answers to data-centric questions. It serves as a personal data assistant, assisting users in exploring and analyzing data. Users have the option to choose from a list of sample datasets, request specific datasets or use cases, or even provide their own datasets. However, it is important to note that the tool is currently in an early access version, with ongoing improvements to the model’s performance, bug fixes, and the addition of more features and datasets. Users are encouraged to provide feedback and report any bugs to contribute to the improvement process.

ChartGPT Cadlabs offers a sample dataset called “Decentralized Exchange Trades,” which contains transaction data across L1 and L2 blockchains. This dataset is periodically updated, ensuring users have access to the latest information. Users can either select a sample question or enter their own question to obtain relevant answers. It is worth mentioning that due to limitations on OpenAI’s API, the tool currently utilizes GPT-3.5 instead of GPT-4, which may result in occasional inconsistencies or less reliable results. ChartGPT Cadlabs is built using Streamlit, providing a user-friendly interface for seamless data exploration and analysis.

Highcharts

Highcharts

Highcharts GPT is a charting tool that utilizes natural language processing to generate Highcharts code through human-like conversations. It enables users to create various reliable and secure data visualizations with different chart types such as line, bar, and pie charts in seconds.

Highcharts GPT is powered by ChatGPT, which allows users to input natural language and receive instant responses, with chatbot technology. Highcharts GPT is easy to use, with its intuitive interface and natural language processing capability. Users can simply type in the data they want to visualize, along with other parameters like the chart type, title, and axis labels, and the tool will create the Highcharts code necessary to generate the chart.

The tool also boasts robust security features to ensure all data being charted remains secure and confidential. Additionally, Highcharts GPT supports a wide variety of chart types and customization options, enabling users to create charts that meet their specific needs. Highcharts GPT also provides seamless integration with other tools and applications, making it a valuable asset for developers and data analysts.

Moreover, Highcharts GPT uses cookies to personalize content, provide social media features, and analyze traffic. In conclusion, Highcharts GPT is a reliable, secure, and user-friendly tool for creating data visualizations in a matter of seconds with the help of natural language processing. Its wide range of chart types and customization options, along with its integration options, make it a highly valuable tool for developers and data analysts alike.

Graphy app

Graphy app

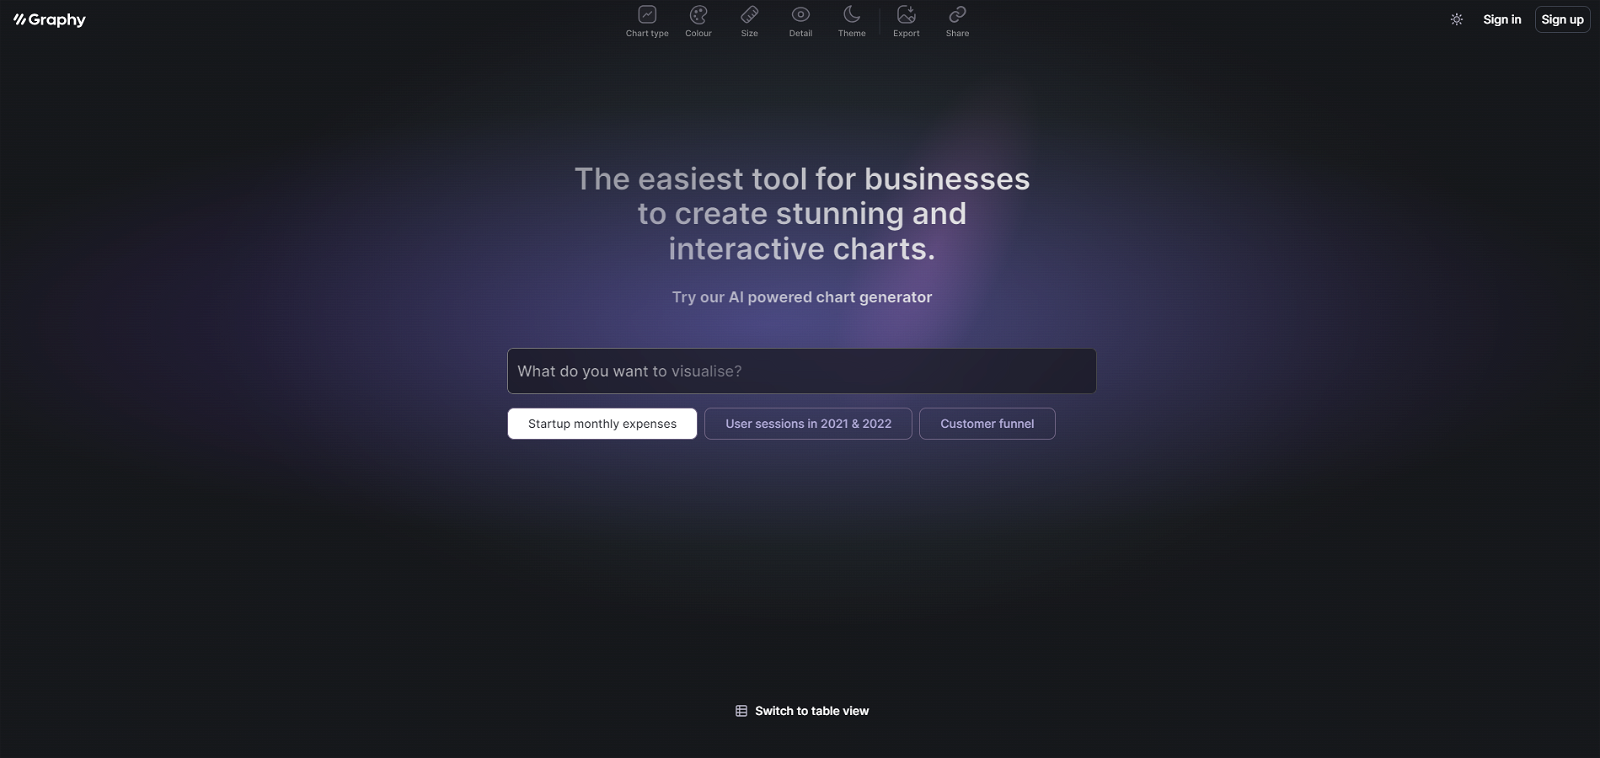
Graphy is a free chart-maker tool that allows businesses to easily create slick and interactive data visualizations. With the help of artificial intelligence, this tool enables users to generate stunning charts without the need for advanced technical skills. The charts can be embedded into various platforms, including Notion and other preferred applications.

By utilizing Graphy, businesses can effectively present their data in a visually appealing and engaging manner. The tool offers a range of chart options, allowing users to showcase different types of data, such as startup monthly expenses, user sessions in specific time frames, and customer funnel analysis. Users also have the option to switch to a table view for a more concise representation of their data.

Graphy prioritizes user convenience by providing a simple and intuitive interface, making it accessible to individuals with varying levels of technical expertise. This allows businesses to save time and resources that would otherwise be spent on manual chart creation or the hiring of specialized personnel. Moreover, the AI-powered capabilities of the tool assist users in generating charts quickly and accurately.

Overall, Graphy is an efficient and user-friendly tool that empowers businesses to create visually impactful data visualizations. By utilizing its features, businesses can effectively present their data, gain insights, and make informed decisions.

ChartyAI

ChartyAI

ChartyAI is a tool that allows users to create charts and visualizations from their data. With ChartyAI, users have the option to create blocks where they can input data manually or upload a CSV file for a quick and easy chart creation process. The tool focuses on simplicity and user-friendliness, making it accessible to both non-technical and technical users.

By providing default blocks, ChartyAI aims to streamline the chart creation process even further, allowing users to select from pre-designed options and customize them to suit their specific needs. This feature enables users to save time and effort when creating visualizations.

ChartyAI also offers a contact option, providing users with the opportunity to offer feedback, make feature requests, or reach out for support. This demonstrates the tool’s commitment to actively listening to its users and continuously improving its functionality.

In summary, ChartyAI is a straightforward tool designed for the creation of charts and visualizations. It offers both manual data input and CSV upload options, providing flexibility to users. With its default blocks, the tool simplifies the chart creation process and saves users time. The contact option ensures that users can express their thoughts and concerns, contributing to the ongoing enhancement of the tool’s user experience.

ChartGen

ChartGen

ChartGen AI is a tool that allows users to effortlessly create visually appealing charts and graphs from their data using as little as one sentence. The process involves a few simple steps: uploading the dataset, describing the type of chart desired, and generating the chart. Alternatively, users can try a random example to explore the tool’s capabilities.

The tool supports various file formats such as CSV, Excel, JSON, and even Google Sheets (with sharing enabled). Users can utilize their preferred data storage method and seamlessly integrate it with ChartGen AI. This flexibility allows for accessible data preparation, eliminating the need for extensive pre-processing before generating the charts.

By offering a user-friendly interface and the ability to generate charts with minimal input, ChartGen AI caters to users who may not have advanced data analytics skills. It provides an efficient solution for individuals or teams looking to visualize their data in a visually compelling manner without the need for extensive coding or technical knowledge.

ChartGen AI is developed by Einblick Analytics Inc., a company that specializes in AI-powered data analytics. While the tool is a stand-alone product, users interested in further exploring the AI capabilities for data workflows can try Einblick’s platform for free, which offers AI conversation functionalities.

In summary, ChartGen AI is a convenient tool that empowers users to effortlessly create aesthetically pleasing charts and graphs from their datasets, enabling data visualization without the need for complex technical skills or time-consuming data transformations.