visualization

NextBI

NextBI

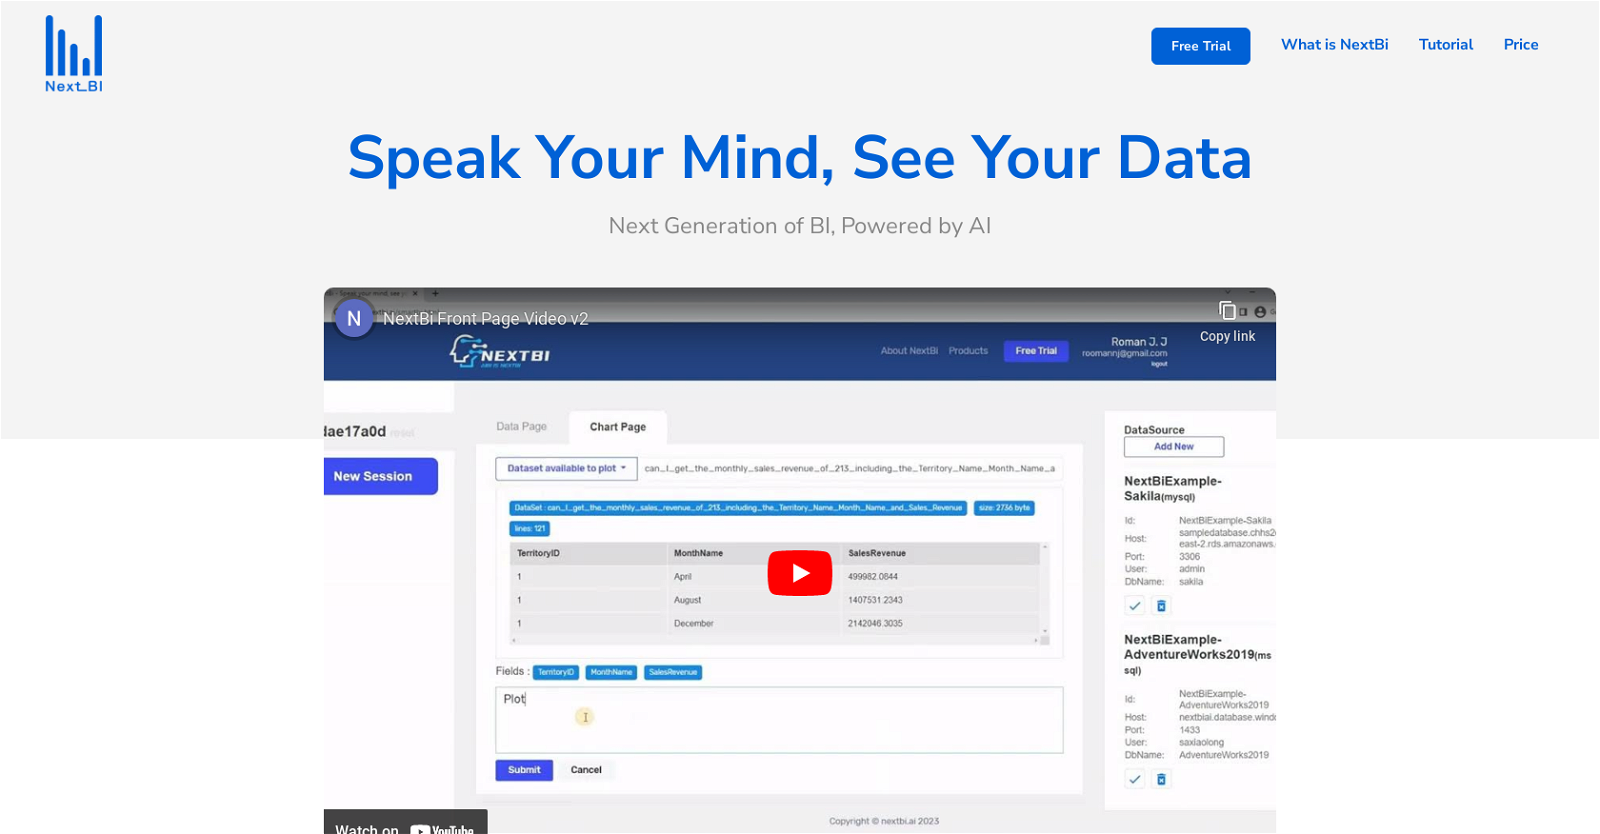
NextBi is a business intelligence (BI) tool that provides an accessible and user-friendly solution for BI reporting and visualization. It is powered by an AI engine that enables end-users to interact with databases without requiring technical expertise or SQL knowledge.

With NextBi, users can collect data by using natural language queries and generate reports within a few minutes. Additionally, the tool also allows users to choose their preferred visualization chart type using plain English, such as pie charts, bar charts, and line graphs.

NextBi is designed to be customizable, and the tool can adapt for modern startups’ needs. It offers a free trial version with limited features and an online experience edition that comes with a monthly subscription cost. NextBi offers an affordable option compared to other BI tools in the market.

Users can choose from the extended license or customized versions that provide additional levels of support and functionality. Overall, NextBi aims to make BI accessible, intuitive, and user-friendly for everyone. It enables businesses to explore their data and gain valuable insights effortlessly. With natural language processing, querying, and visualization, NextBi makes database interaction and analysis more intuitive and easy.
NextBI Read More »

ChartPixel

ChartPixel

ChartPixel is an AI tool that allows users to effortlessly transform raw data into insightful and visually appealing charts in mere seconds. With its intuitive interface and AI-assisted annotations, it eliminates the complexity of data analysis tools and offers a user-friendly way to grasp data patterns and create compelling presentations at all skill levels.

One of the key features of ChartPixel is its ability to instantly visualize uploaded data. It automatically transforms the data into a variety of explained charts and provides summary insights, enhancing comprehension and making it easier to understand the data at a glance.

ChartPixel also offers smart data analysis capabilities. It auto-selects relevant columns, cleans up messy data, and suggests meaningful features for comprehensive data interpretation. This saves users time and effort in manually analyzing and preparing their data, allowing them to focus on extracting valuable insights.

From raw data to presentation, ChartPixel seamlessly converts data insights into PowerPoint presentations. The resulting presentations are not only visually impressive but also statistically accurate, ensuring that the data is effectively communicated to the audience.

In addition, ChartPixel offers web data integration. Users can utilize a keyword search tool to find and integrate web data into stunning charts, expanding their analysis capabilities and enabling them to incorporate external data sources into their visualizations.

ChartPixel is also available on mobile, allowing users to access and utilize its features on the go. Whether in the office or on a business trip, users can conveniently get insights and create charts anytime, anywhere.

Lastly, ChartPixel offers AI-generated chart colors, adding a touch of creativity and uniqueness to the visualizations. With its user-friendly interface, powerful features, and mobile accessibility, ChartPixel is a valuable tool for anyone looking to transform raw data into meaningful and visually appealing charts.

ChartPixel Read More »