visualizations

Chart My Life

Chart My Life

Chart My Life is an AI-powered tool that serves as a flexible and customizable diary for tracking a wide range of habits and daily activities. With a simple voice interface, users can easily record and visualize various aspects of their lives, such as calorie intake, reading progress, physical activities, and even personal moments like children’s tantrums. Unlike other tracking apps, Chart My Life does not impose rigid standards but allows users to define their own tracking criteria.

Powered by OpenAI’s GPT-4 model, the tool offers unrestricted freedom, enabling users to track activities in unique and diverse scenarios. It uses the advanced Whisper voice recognition model, surpassing the capabilities of popular voice assistants like Siri and Google, allowing users to speak naturally and combine languages without any limitations.

Chart My Life provides a desktop and mobile interface where users can access and customize their data. Through the voice interface, users can request specific graphs that combine different metrics, providing real insights into their habits and overall lifestyle. The tool emphasizes the value of approximation rather than exact numbers, as it believes that broad and approximate data can still yield actionable insights. With Chart My Life, users can gain a holistic understanding of their lives, even without precise labels and measurements.

Currently, access to Chart My Life is invite-only due to the cost of running GPT-4 APIs and Whisper. Users are encouraged to join the waitlist to secure their spot and be among the first to start graphing their own lives with this comprehensive AI-powered diary tool.
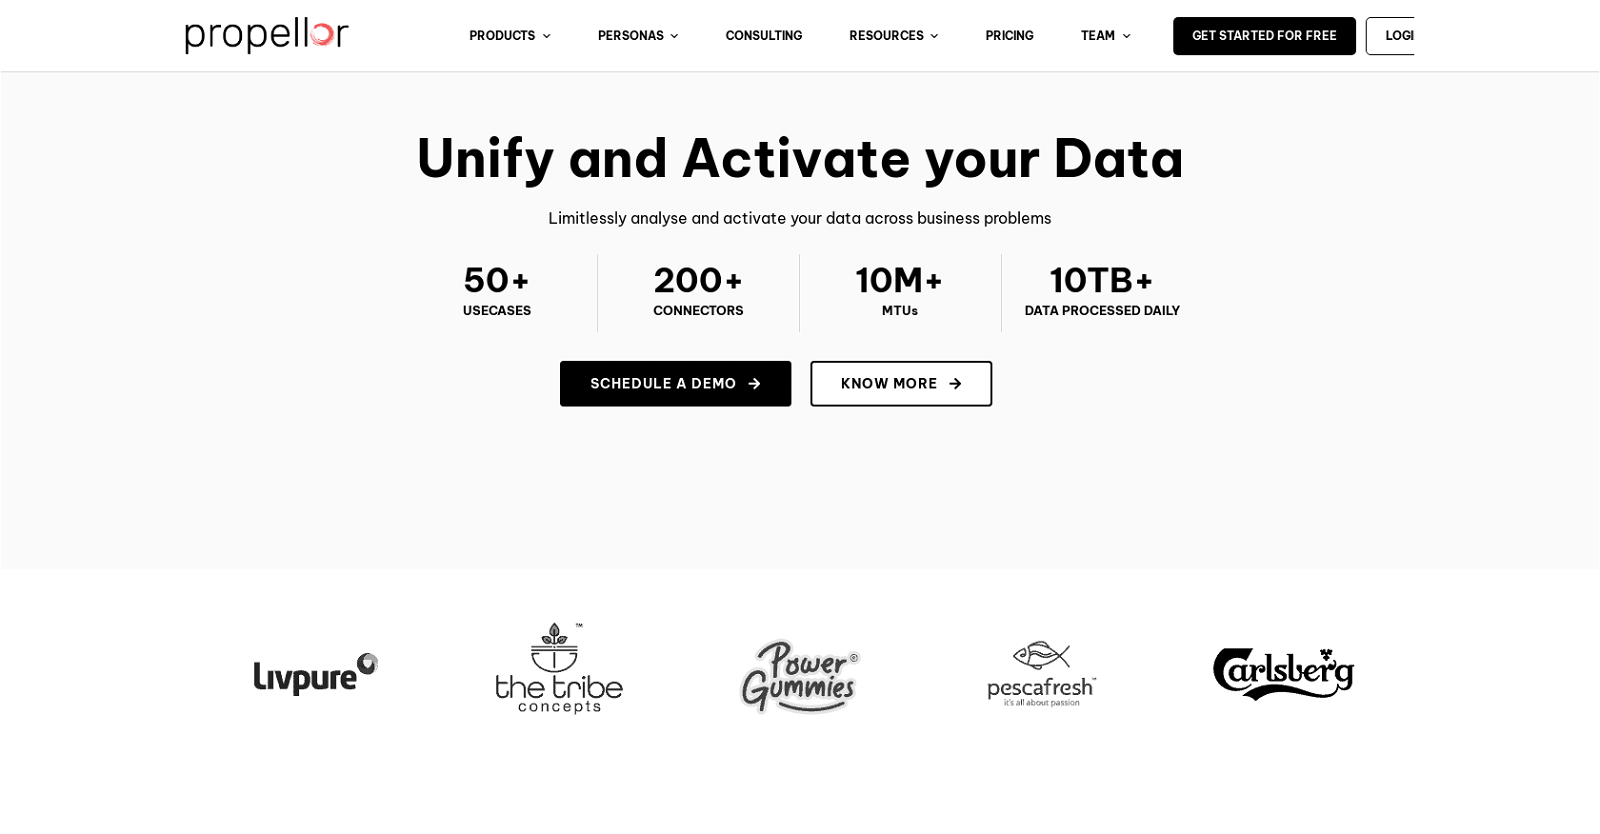
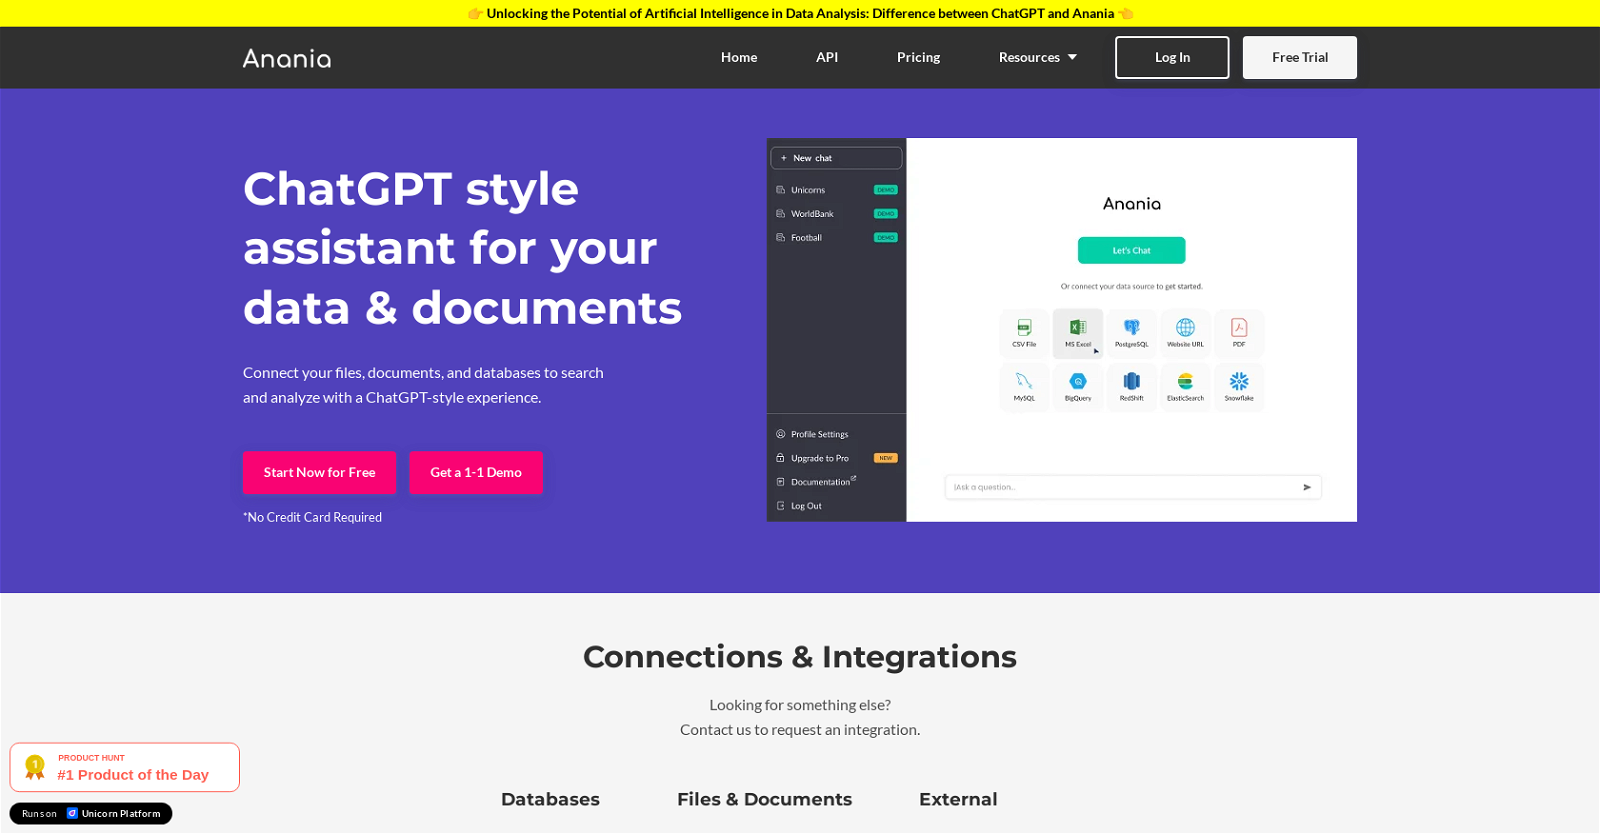
Chart My Life Read More »

Propellor

Propellor

Propellor is a tool that allows you to unify and activate your data, enabling you to analyze it limitlessly across various business problems. With over 200 connectors, Propellor offers seamless integration with different data sources, giving you access to a wide range of data points. This tool processes a significant amount of data on a daily basis, handling terabytes of data effortlessly.

One of the key features of Propellor is its ability to create customized charts and dashboards tailored to your specific use case. With the option to create your own visualizations, you can gain deeper insights and effectively communicate your data analysis to stakeholders. Additionally, Propellor offers ready-to-use dashboard templates that cover a wide range of generic and relevant charts, making it easier for you to get started without spending hours on customization.

To better analyze your data, Propellor provides data apps that allow you to delve into various analysis results, such as the purchase journey of your customers or other relevant metrics. These data apps enable you to dig deeper into your data and uncover valuable insights that can inform your decision-making process.

Overall, Propellor aims to reinvent decision-making dashboards by providing a flexible and customizable platform for analyzing and activating your data. Whether you are a business leader, marketing leader, growth manager, or product manager, Propellor offers tailored solutions to meet your specific needs.

Propellor Read More »

Anania

Anania

Anania is a ChatGPT-style assistant designed specifically for analytics and documents. It allows users to connect various data sources such as Excel files, documents, databases, URLs, and more. With Anania, users can ask questions about their data in plain English and receive insightful analysis.

Anania boasts several features that enhance the data analysis experience. It enables the translation of English questions into SQL queries, facilitating seamless interaction with the data. The tool also provides data visualization capabilities, allowing users to create interactive charts for a better understanding of their data. Additionally, Anania prioritizes data security by ensuring that analysis is conducted on the user’s own servers.

Integration with other systems is made possible through the Anania API, which offers fast and secure access to the tool’s generative AI capabilities. The API can be easily integrated into existing products, and customization options are available to meet the individual needs of businesses.

Anania simplifies the data analysis process by providing a single interface for all data sources and knowledge bases. Setting up and configuring the tool is hassle-free, as no extensive setup process is required. Anania can handle both big and semi-structured datasets, making it suitable for a wide range of analytical tasks.

Overall, Anania empowers users to revolutionize decision-making processes through its user-friendly interface, powerful AI capabilities, and focus on data privacy and security.

Anania Read More »

Layernext

Layernext

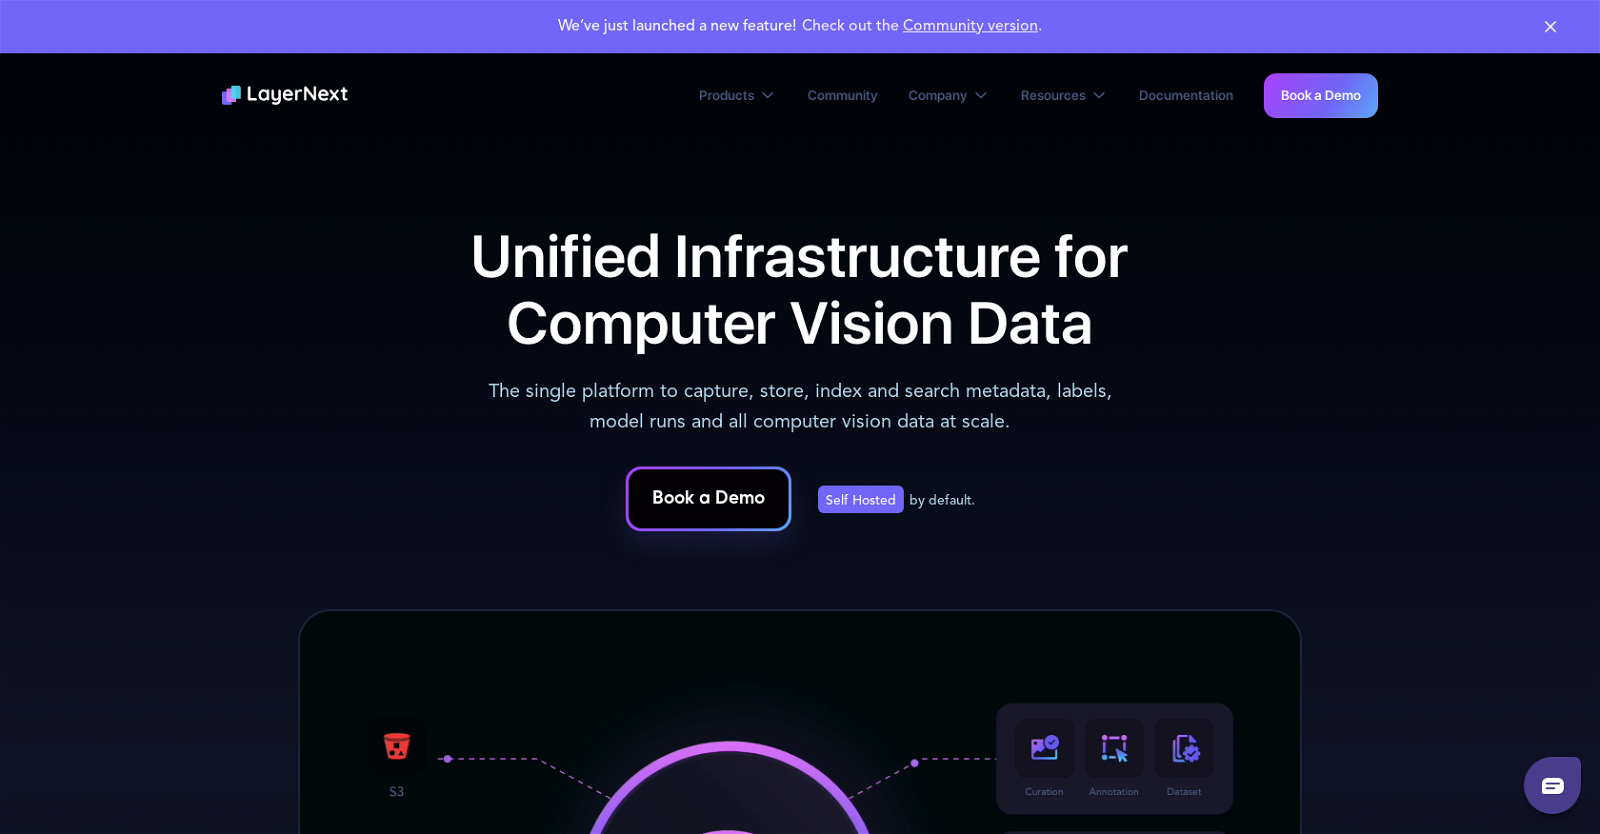
LayerNext is an AI data infrastructure tool specifically designed for computer vision (CV) projects. It enables AI teams to efficiently collect, curate, label, and search large-scale CV datasets. With LayerNext, users can organize and manage their training datasets with version control, making it easier to develop and iterate on models.

One of the key features of LayerNext is its DataLake, which serves as a unified repository for all AI data. This includes raw images and videos, curated data, ground truth, and model outcomes. The DataLake provides a built-in viewer, allowing users to visualize their data in one place and easily search and explore it.

LayerNext also offers annotation tools through its Annotation Studio, allowing users to label image and video data at scale. The platform includes built-in analytic tools to help analyze the effectiveness of training data, identify data gaps, and address model and label errors.

The tool emphasizes collaboration and integration, offering SDKs and APIs for seamless integration with other computer vision applications and services. It also provides specialized apps for processes such as curation and annotation, allowing for streamlined workflows.

LayerNext is self-hosted by default, providing users with control over their data and ensuring compliance with regulations such as HIPAA and GDPR. The flexibility and security of LayerNext make it suitable for various industries, including retail, agriculture, healthcare, and construction.

Overall, LayerNext aims to enhance AI team productivity and collaboration by providing purpose-built data tools and automated workflows for computer vision projects. Its user-friendly interface and comprehensive features simplify the CV workflow and enable teams to focus on the core aspects of their AI projects.

Layernext Read More »

NativeBI

NativeBI

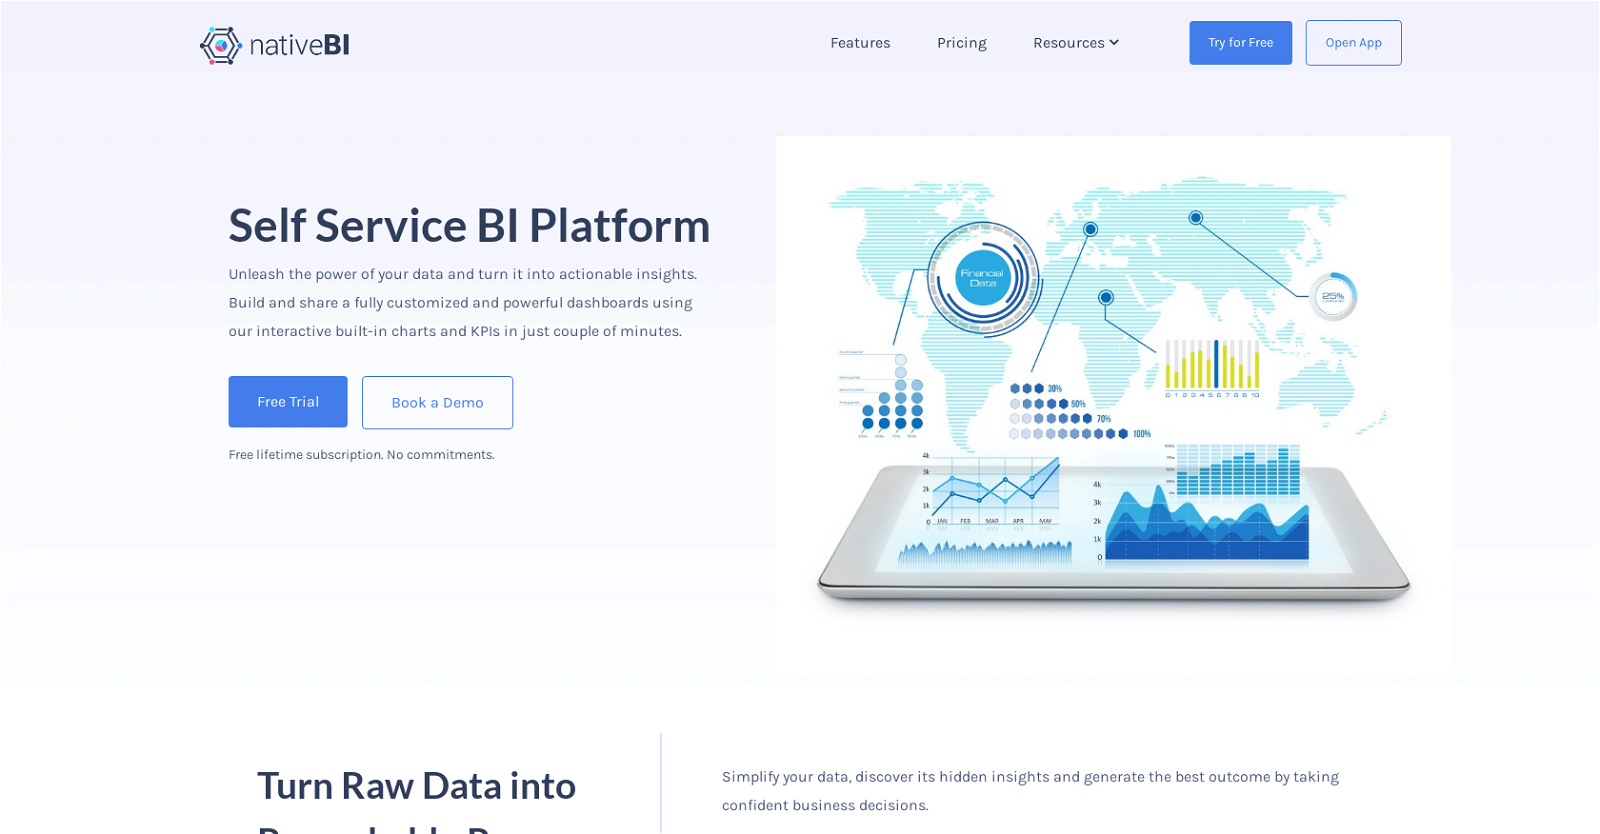
NativeBI is a self-service business intelligence platform designed to empower business leaders by providing them with the ability to visualize, study, and analyze their organization’s data in one central location. The platform offers interactive dashboards and key performance indicators (KPIs) for efficient data exploration.

With NativeBI, users can build fully customized and powerful dashboards using interactive built-in charts and KPIs within minutes. The tool simplifies data consolidation by combining internal and external data sources, allowing users to analyze these sources as a single entity. The platform also emphasizes data visualization, providing responsive and interactive dashboards that enable users to uncover hidden insights.

Additionally, NativeBI offers chat functionality powered by the ChatGPT model, enabling ad-hoc analysis using natural language. Collaboration features allow users to securely share dashboards and reports with their team, fostering coordination and informed decision-making. NativeBI integrates seamlessly with various data sources, such as relational databases, spreadsheets, REST APIs, and cloud data sources. Its smart data extraction engine ensures up-to-date data exploration.

The tool supports unlimited viewers, enabling organizations to share dashboards and reports with an unlimited number of users at no extra cost. NativeBI offers flexible subscription plans suitable for different company sizes and is open to discussing customized plans and on-premise deployments. Ultimately, NativeBI aims to simplify complex data and transform it into actionable insights, making every user a power analyst.

NativeBI Read More »

LIDA

LIDA

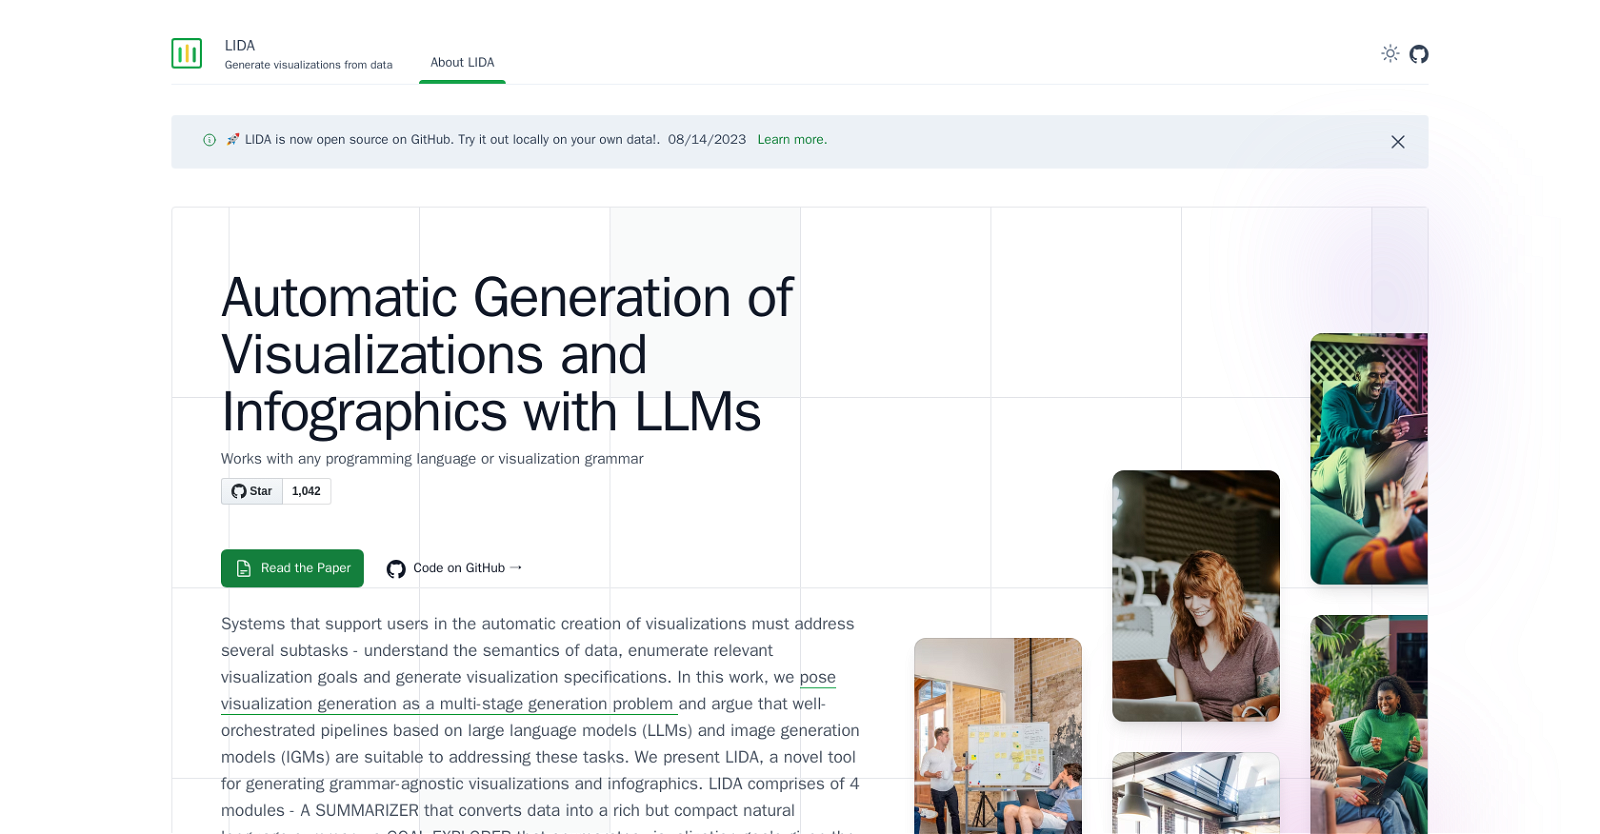
LIDA is a powerful AI tool designed to automate data exploration and generate visualizations and infographics using large language models (LLMs) like ChatGPT and GPT4. It offers a conversational interface that allows users to automatically generate grammar-agnostic visualizations from their data. LIDA consists of four modules: the Summarizer, Goal Explorer, VisGenerator, and Infographer, each serving a specific purpose in the visualization generation process.

The Summarizer module converts data into a concise natural language summary, providing a quick overview of the dataset. The Goal Explorer module enumerates visualization goals based on the available data, helping users identify potential visualizations that can effectively represent their data. The VisGenerator module generates, refines, executes, and filters visualization code, allowing users to create visualizations in various programming languages and visualization grammars, including Python (e.g., Altair, Matplotlib, Seaborn), R, C , and more. Lastly, the Infographer module produces data-faithful stylized graphics using image generation models, enabling the creation of visually appealing infographics.

LIDA is compatible with any programming language or visualization grammar, providing flexibility to users in choosing their preferred tools. It offers operations on existing visualizations, such as visualization explanation, self-evaluation, automatic repair, and recommendation, enhancing the usability and effectiveness of the generated visualizations.

The tool supports various capabilities, including data summarization, automated data exploration, grammar-agnostic visualizations, and infographics generation. By leveraging the language modeling and code-writing capabilities of LLMs, LIDA enables automated visualization generation. It combines LLMs and image generation models (IGMs) in its architecture to address the multi-stage generation problem of visualization creation.

LIDA is an open-source tool that provides a Python API and a hybrid user interface for interactive chart, infographic, and data story generation. While it may have limitations with visualization grammars not well-represented in the LLM’s training dataset and performance variations depending on the choice of visualization libraries and code generation capabilities, LIDA remains a powerful tool for automating the visualization generation process, saving time and effort for data analysts and researchers.

LIDA Read More »

Superluminal

Superluminal

Superluminal is an AI tool designed to serve as a copilot for data dashboards. With just a few lines of code, users can add an AI copilot to their product’s data dashboard. This tool aims to enhance the user experience by enabling frictionless and conversational data interaction. By integrating Superluminal, customers can extract meaningful insights from the data already present on their dashboard without the need for extensive engineering work.

Superluminal handles various complex tasks behind the scenes to provide reliable and accurate answers to user queries. These tasks include context synthesis, code generation, compute instance management, prompt optimization, chain-of-thought reasoning, and reflection-based code verification. The tool enables customers to receive reliable and insightful answers to their queries in the form of text or visual representation, such as charts. Superluminal also offers customization options, allowing users to tailor the tool’s user interface to their branding. Additionally, it supports multiple languages, making it accessible to a diverse range of users.

Data security is a top priority for Superluminal. The tool ensures the protection of customer information by strictly complying with security regulations. It does not share data with third parties, encrypts data in-transit and at rest, and purges all data at the end of a session. The tool is hosted securely with top-tier cloud providers in the US/EU.

Superluminal offers pricing plans suitable for businesses of all sizes, with a pay-as-you-go model. It also provides extensive documentation and tutorials for developers to easily integrate the tool into their data dashboards.

Superluminal Read More »

Magic Design by Canva

Magic Design by Canva

Magic Design™ is a free online AI design tool offered by Canva. This tool utilizes artificial intelligence to automatically generate designs based on user input. With Magic Design™, users can upload their own media, such as text and images, and watch as the tool creates customized templates that match the content and context of their design needs. Magic Design™ offers a selection of refined templates that are tailored to the user’s specific requirements. Users have the option to choose from eight automatically generated templates, which they can further edit and resize if they have a Pro account. This tool leverages Canva’s extensive library of templates, images, fonts, and graphic elements, and uses AI technology to craft designs that bring ideas to life.One of the key features of Magic Design™ is its ability to generate presentations effortlessly. Users can simply type in their idea or concept, and Magic Design™ will generate an outline, slides, and content for them. This feature saves users time by populating their slides with relevant and visually appealing content.Additionally, Magic Design™ also offers fast and streamlined video editing capabilities. Users can combine their video clips and images into a short video and add the perfect soundtrack from Canva’s music recommendations. This feature allows users to create engaging videos quickly, helping them maintain audience engagement.Overall, Magic Design™ is a versatile AI design tool that helps users bring their ideas to life by providing customized and visually appealing design templates for various purposes, including presentations and videos.

Magic Design by Canva Read More »