analysis

SmartflowAI

SmartflowAI

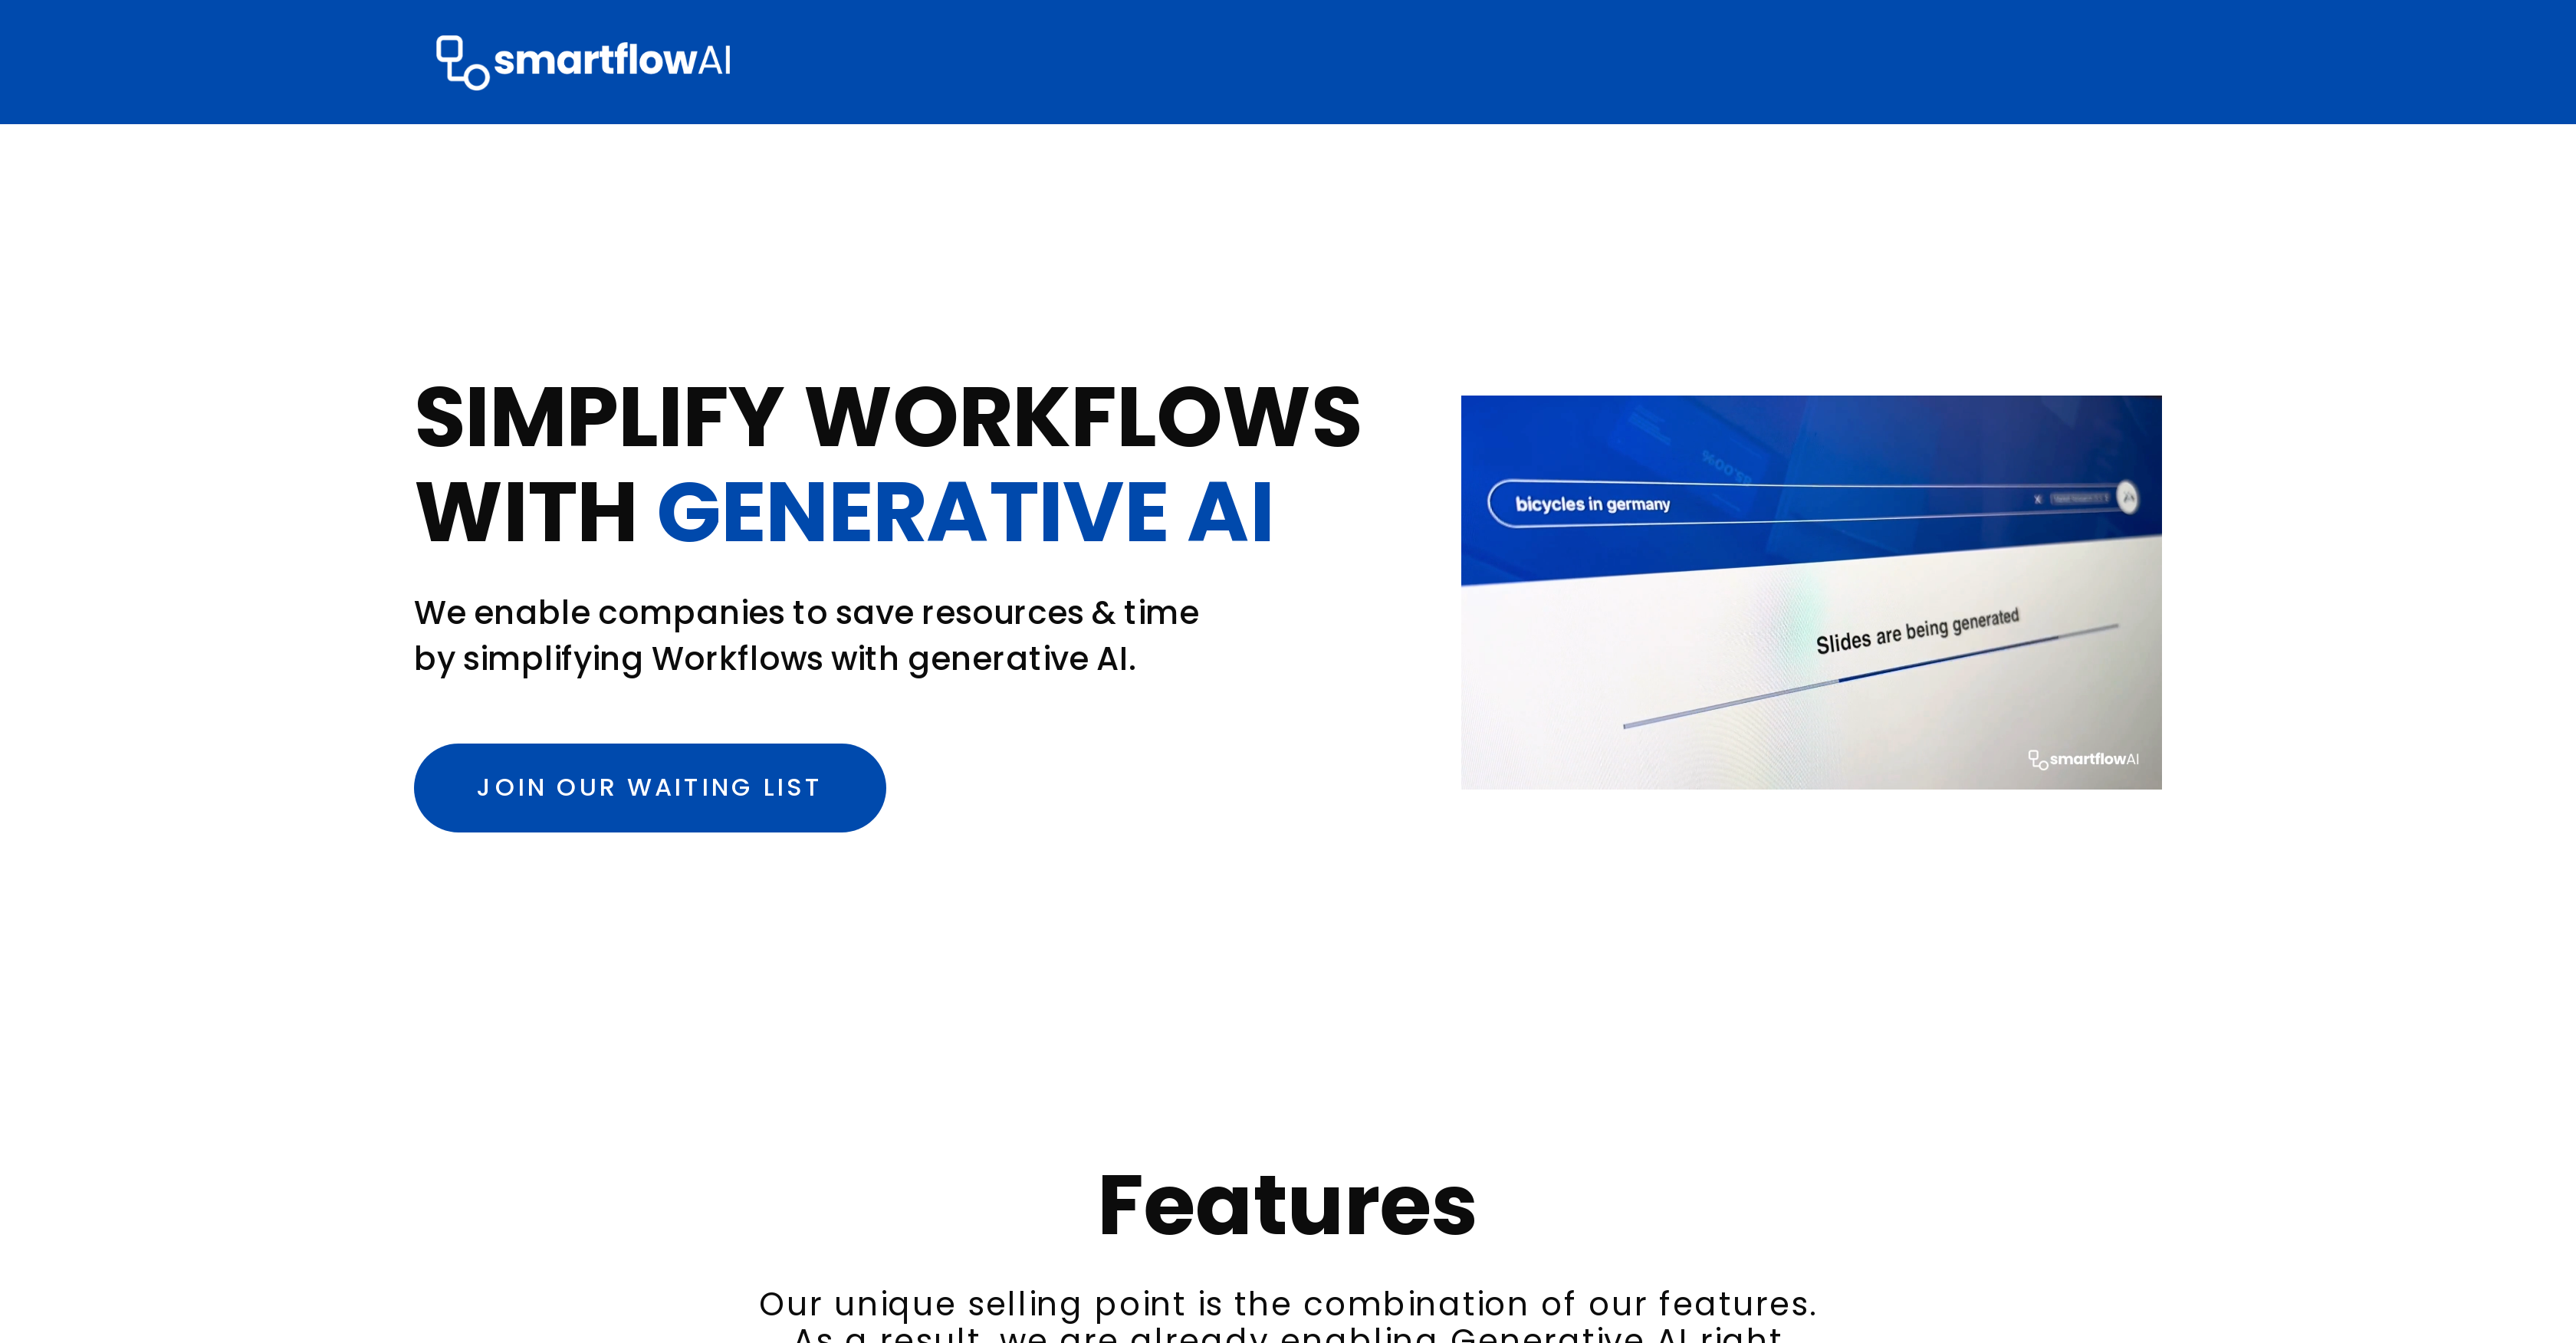
SmartflowAI is an AI tool that simplifies workflows for companies, saving them resources and time through the use of generative AI. The platform offers pre-built workflows that are aligned with the needs of customers, and are ready to use.

The tool is built using a complex Generative AI Tech Stack, comprising of a range of algorithms, AI models, and Data APIs, which are combined into unique intelligent flows. The combination of the features of the platform enable Generative AI to be used immediately.

SmartflowAI can be used to generate market research for businesses, as an example of its capabilities. The tool’s focus is on simplifying and streamlining workflows for companies, while simultaneously improving efficiency and reducing the consumption of resources, by using AI.

SmartflowAI Read More »

Chartify

Chartify

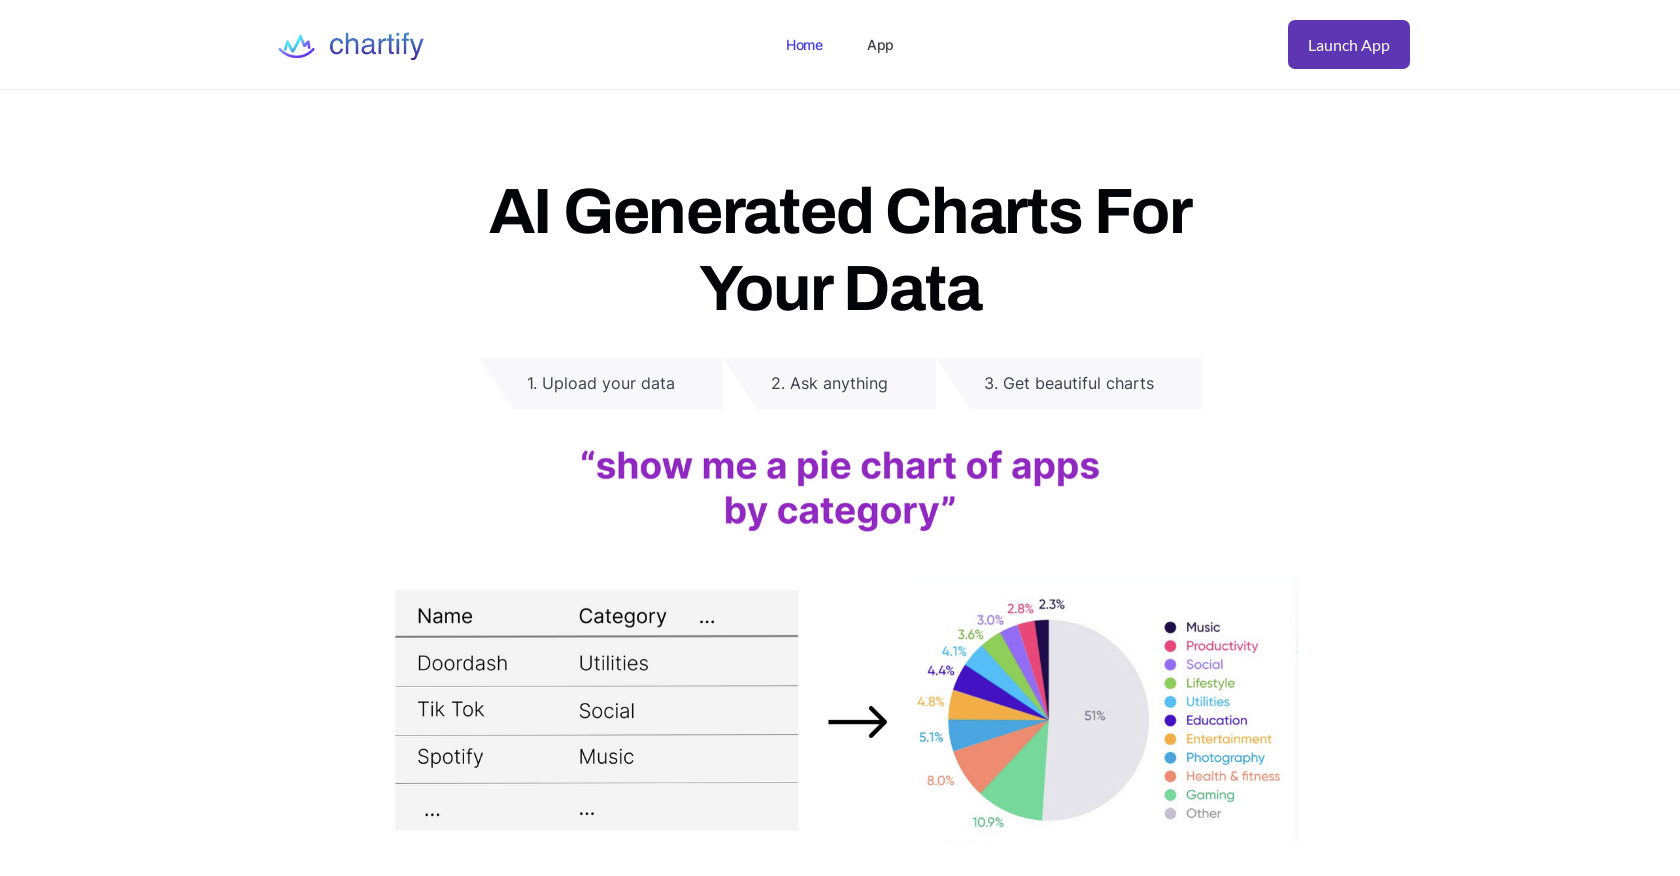
Chartify is an AI-powered tool that assists in generating interactive charts and graphs from CSVs and database tables. With Chartify, users can upload their data, and the AI will recommend a variety of visualizations, including pie charts, bar charts, and line graphs. Users can also request their preferred chart types, and the AI will generate beautiful charts across Plotly, Matplotlib, Seaborn, and Charts.js.

Chartify eliminates the need for manually coding up charts in Plotly or using frustrating chart editors in Google Sheets and Excel. Chartify welcomes users to upload their data via CSV, Postgres, or MySQL. The AI tool will suggest recommended visualizations right away, based on the data provided. Users can ask for a specific chart type, and the AI will provide various options and styles.

Chartify’s intuitive interface provides an entirely new way to interact with data, and users can explore data from all angles by using a variety of visualizations. Overall, Chartify is an excellent tool for anyone looking to quickly generate engaging and data-driven insights.

Chartify Read More »

DataSquirrel

DataSquirrel

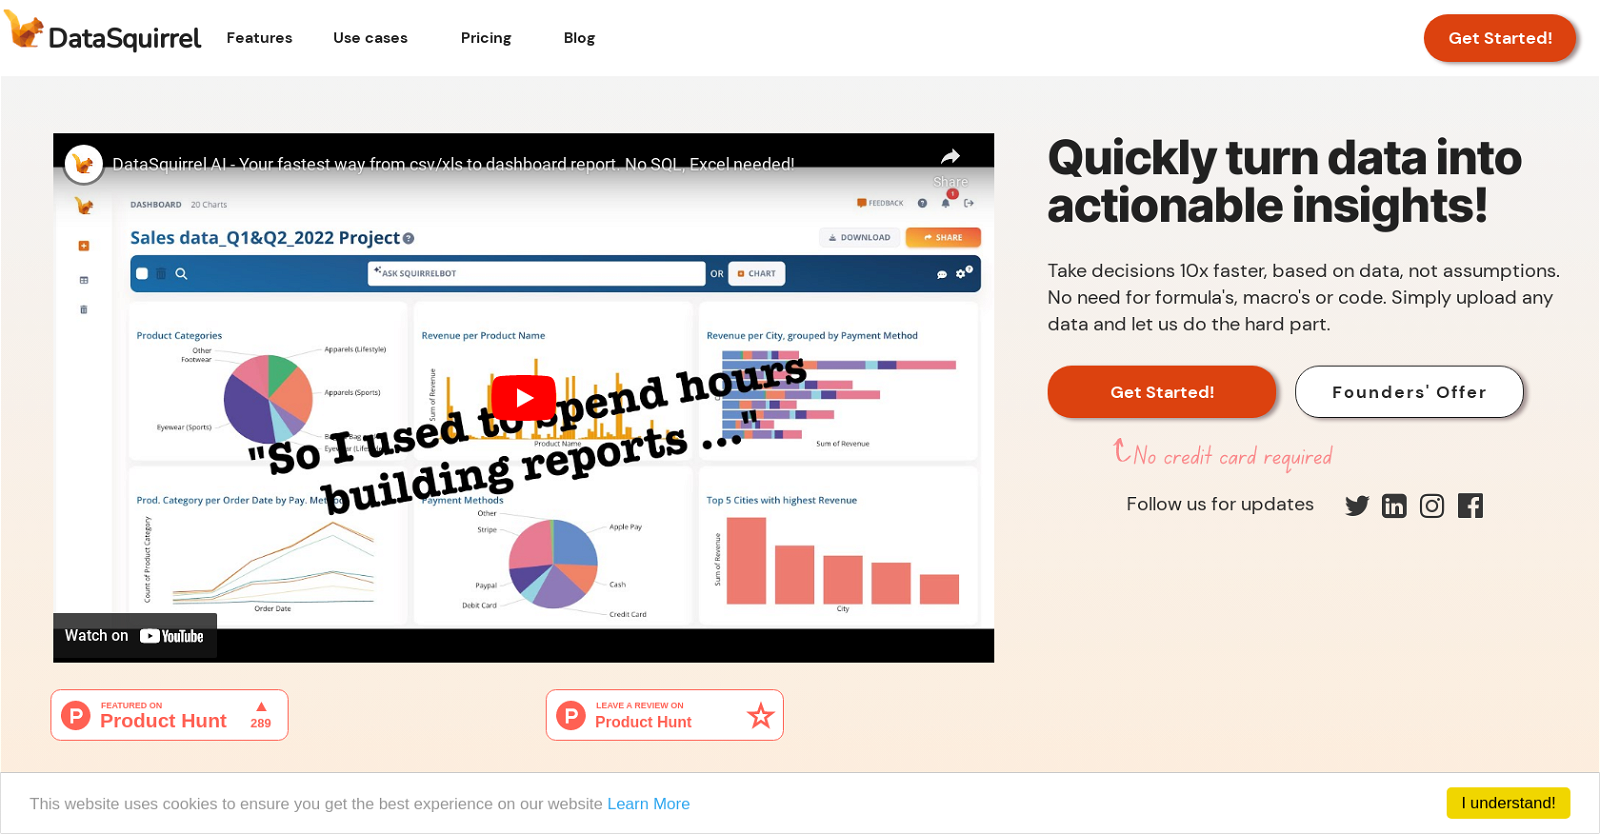
DataSquirrel.ai is an AI-powered data analytics tool that automates data cleaning and visualization processes, helping users to quickly turn raw data into actionable insights without the need for formulas, macros, or code. Users can upload Excel, CSV, or Google Sheet data files, which are automatically cleaned for inconsistencies by DataSquirrel’s AI system. The tool also offers auto-analysis and customizable interactive dashboards or reports, enabling users to create reports and dashboards in minutes.

DataSquirrel saves users time and reduces stress by eliminating manual data cleaning processes, automatically correcting input errors, empty rows, typos, and different date formats, and generating compelling visuals that tell the story of their data. DataSquirrel’s platform is GDPR/PDPA-compliant, and its features include secure data processing, anonymization by default, and easy collaboration with team members through visual sharing, commenting, and annotation capabilities.

Users can create different reports with only relevant charts, KPIs, or tabular data for different audiences and share them as dashboards, presentations, or PDFs. DataSquirrel also offers use cases across various industries, including B2B eCommerce, HR, financial accounting, and survey data analysis. With a user-friendly interface and guided data processing, DataSquirrel aims to help users make better decisions faster and see data as both exciting and useful.

DataSquirrel Read More »

Hal9

Hal9

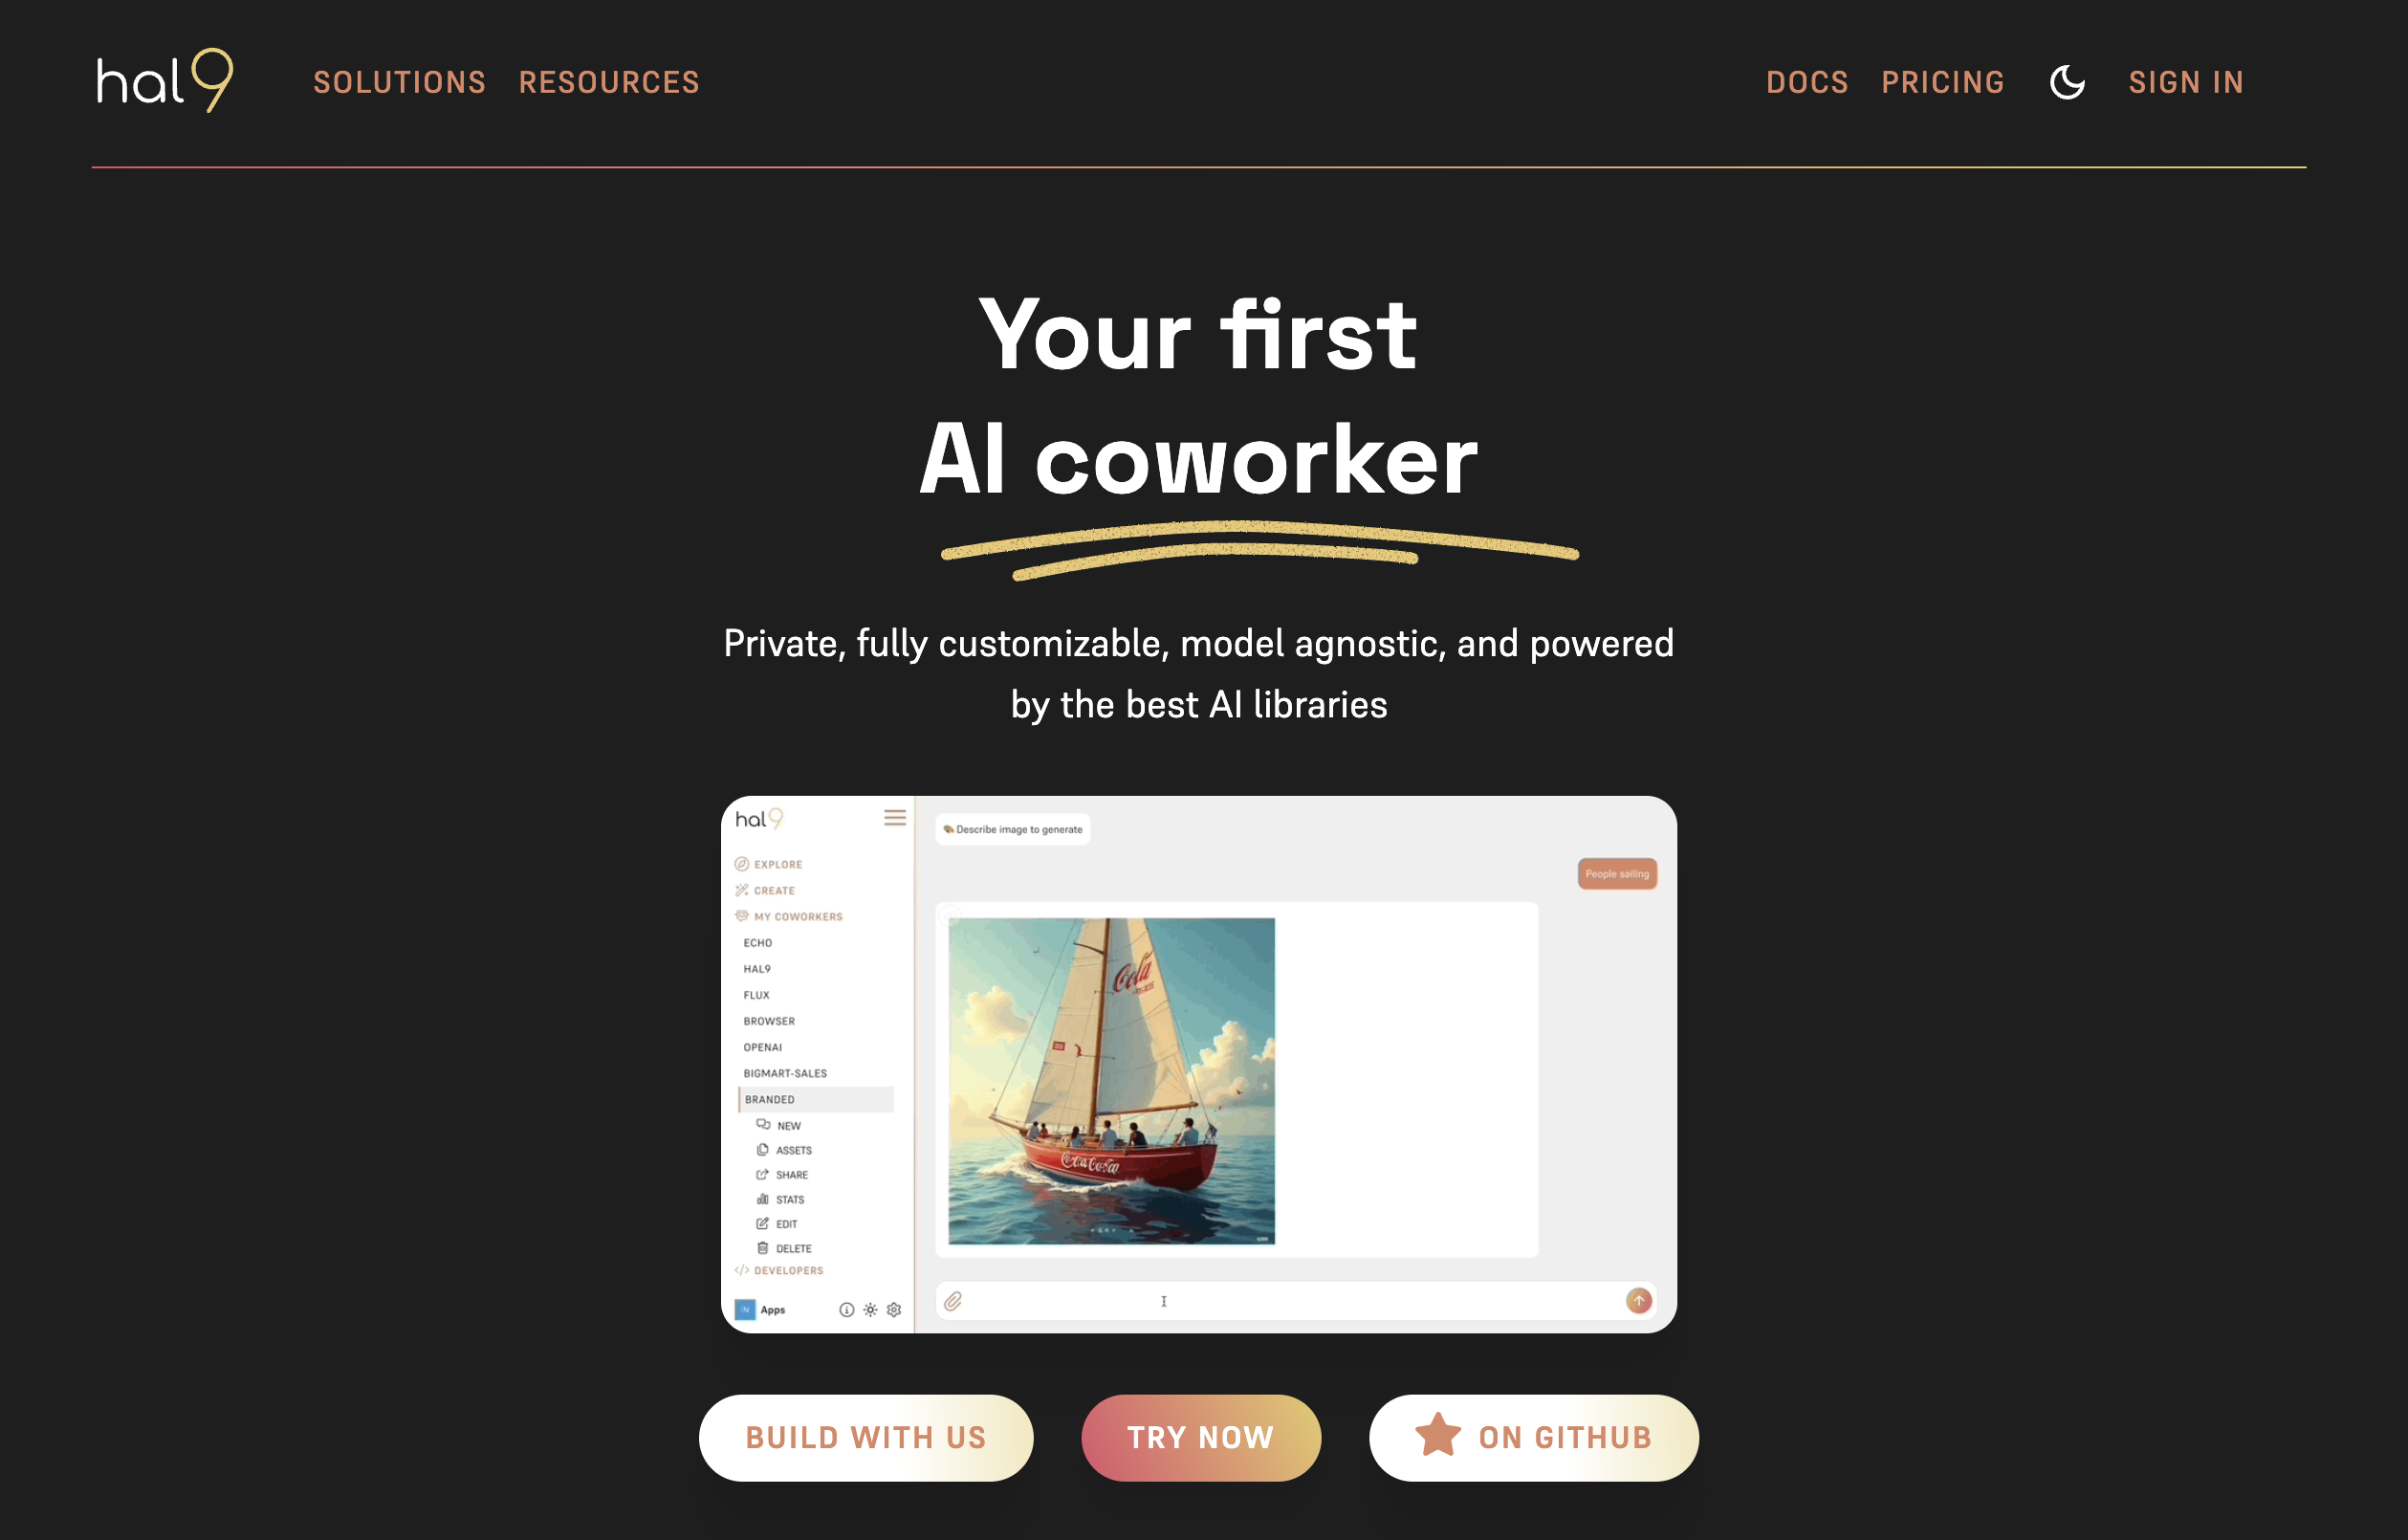
Hal9 is a powerful conversational AI tool that revolutionizes the way teams interact with data. With Hal9, users can simply ask a question and receive instant insights, charts, maps, and interactive controls based on their data. This self-service analytics solution empowers business users to access information quickly and efficiently.

By leveraging the conversational capabilities of Hal9, users can effortlessly communicate with their data, eliminating the need for complex queries or coding. The tool’s ability to provide facts, visualizations, and interactive controls allows for a seamless and intuitive data exploration experience.

One of the key advantages of Hal9 is its ability to save and share results with the rest of the team. This feature promotes collaboration and knowledge sharing, enabling faster decision-making processes. Business users can easily distribute insights and findings, ensuring that everyone stays informed and aligned.

Hal9 offers flexibility in terms of data sources. It can be connected to databases or used with CSV files, accommodating various data storage systems. Additionally, users have the option to access Hal9 through a browser or install it on-premises for enhanced security.

Based in Seattle, Washington, Hal9 was incubated at the prestigious Allen Institute for AI (AI2). This affiliation ensures that the tool is built on cutting-edge AI technology and benefits from the expertise of leading researchers and developers in the field.

In summary, Hal9 is a conversational AI solution that empowers teams to chat with their data, enabling self-service analytics. With its ability to provide instant insights, visualizations, and interactive controls, Hal9 accelerates the data exploration process for business users while increasing productivity for data teams. Whether connected to a database or used with CSV files, Hal9 offers a seamless and secure experience, making it a valuable asset for any organization.

Hal9 Read More »

SayData

SayData

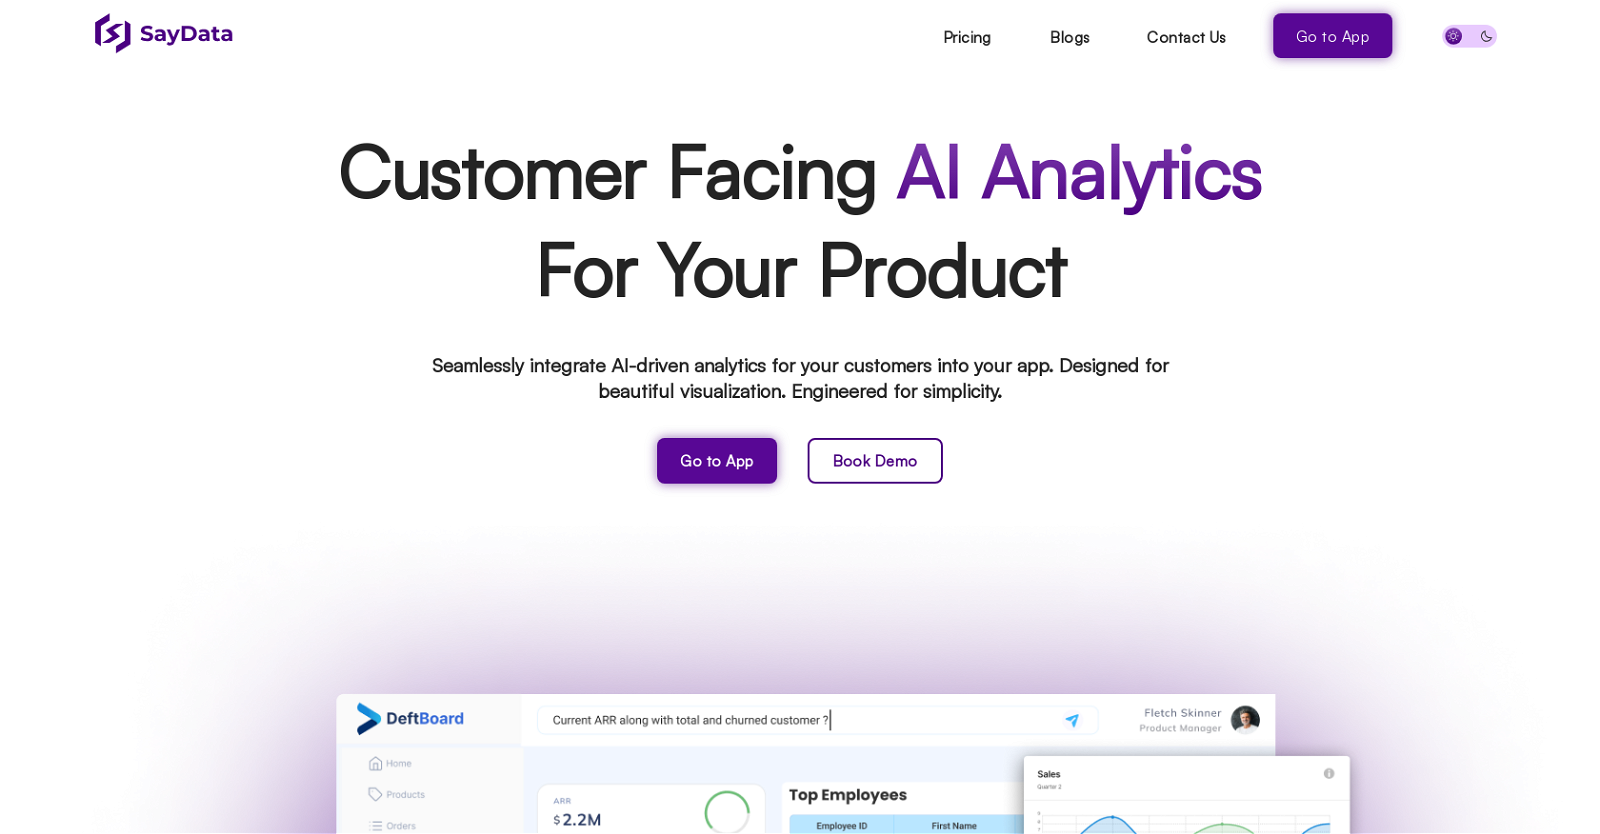
SayData is a customer-facing analytics tool designed specifically for SaaS platforms. It seamlessly integrates AI-driven analytics into your application, providing beautiful visualizations and a user-friendly experience. With SayData, there’s no need for complicated SQL queries or complex programming languages. Users can simply ask questions in plain English, and the tool will automatically process and analyze the data to provide insights.

The tool offers a comprehensive suite of data visualization and analysis tools, enabling users to explore and uncover insights in real-time. Custom dashboards and reports can be created to showcase data in an easily understandable format. SayData is also tailored to the unique needs of each business, allowing users to ask questions that are specific to their industry and operations.

SayData supports various data integrations, including MySQL, ClickHouse, Athena, MariaDB, PostgreSQL, MongoDB, Rocket, and Snowflake. It can be seamlessly integrated into dashboards, applications, Slack workspaces, and shared via links. The tool also offers white-label analytics, providing users with a secure portal to view their own data.

When it comes to data security, SayData ensures complete privacy with its privacy-first architecture. The tool undergoes annual penetration tests to maintain top-notch security measures.

SayData offers flexible pricing options, including a Standard Plan for individuals and small businesses, a Growth Plan for growing enterprises, and an Enterprise Plan for large organizations. Each plan has different features and support levels to cater to specific needs.

Overall, SayData is a powerful AI analytics tool that simplifies data analysis, enhances data visualization, and provides valuable insights for SaaS platforms.

SayData Read More »

LIDA

LIDA

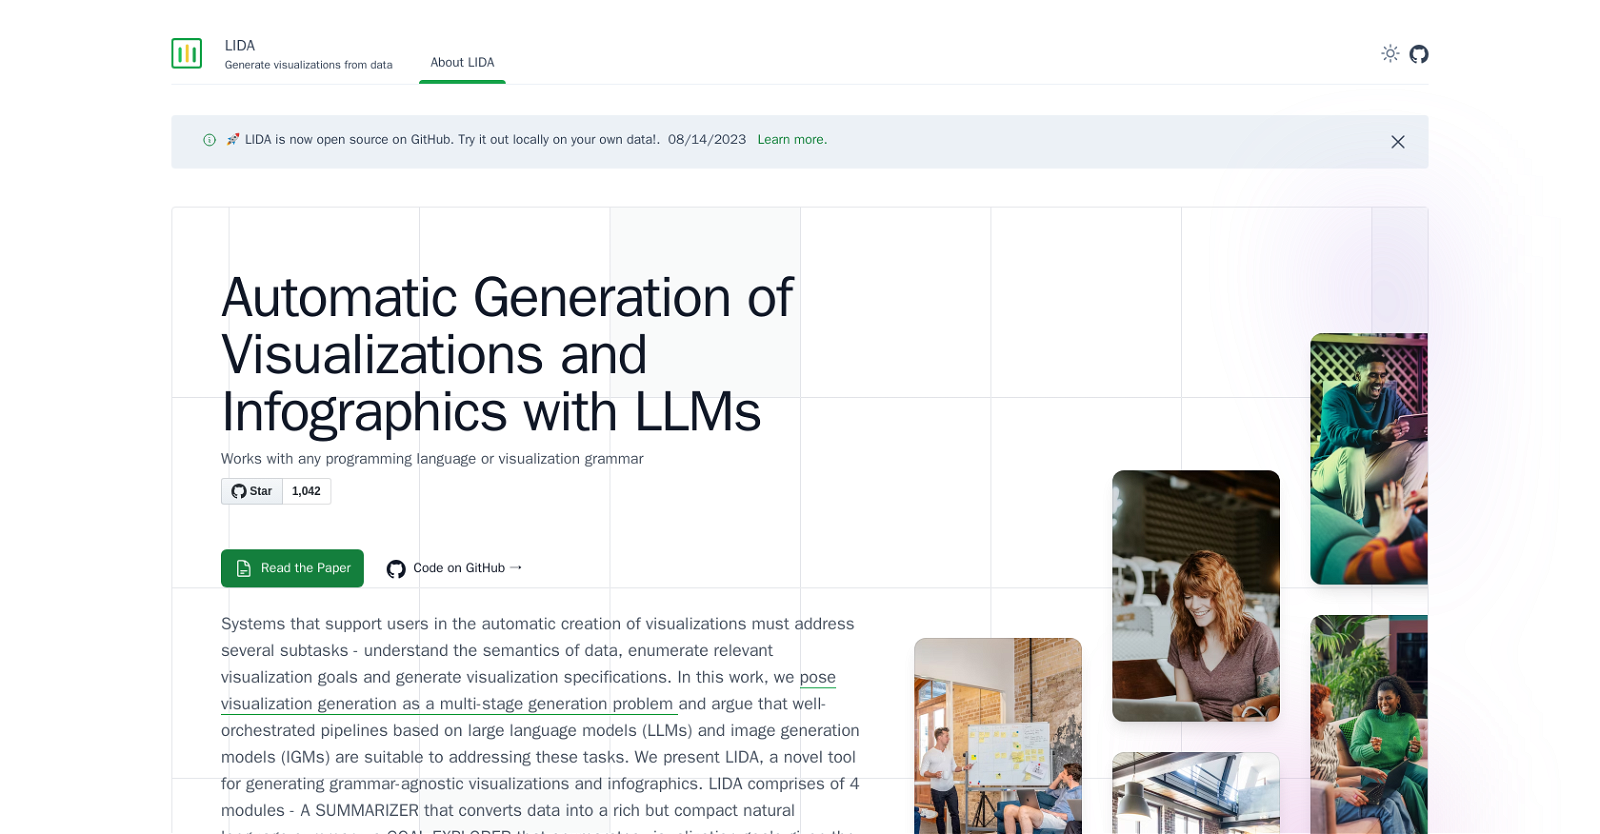
LIDA is a powerful AI tool designed to automate data exploration and generate visualizations and infographics using large language models (LLMs) like ChatGPT and GPT4. It offers a conversational interface that allows users to automatically generate grammar-agnostic visualizations from their data. LIDA consists of four modules: the Summarizer, Goal Explorer, VisGenerator, and Infographer, each serving a specific purpose in the visualization generation process.

The Summarizer module converts data into a concise natural language summary, providing a quick overview of the dataset. The Goal Explorer module enumerates visualization goals based on the available data, helping users identify potential visualizations that can effectively represent their data. The VisGenerator module generates, refines, executes, and filters visualization code, allowing users to create visualizations in various programming languages and visualization grammars, including Python (e.g., Altair, Matplotlib, Seaborn), R, C , and more. Lastly, the Infographer module produces data-faithful stylized graphics using image generation models, enabling the creation of visually appealing infographics.

LIDA is compatible with any programming language or visualization grammar, providing flexibility to users in choosing their preferred tools. It offers operations on existing visualizations, such as visualization explanation, self-evaluation, automatic repair, and recommendation, enhancing the usability and effectiveness of the generated visualizations.

The tool supports various capabilities, including data summarization, automated data exploration, grammar-agnostic visualizations, and infographics generation. By leveraging the language modeling and code-writing capabilities of LLMs, LIDA enables automated visualization generation. It combines LLMs and image generation models (IGMs) in its architecture to address the multi-stage generation problem of visualization creation.

LIDA is an open-source tool that provides a Python API and a hybrid user interface for interactive chart, infographic, and data story generation. While it may have limitations with visualization grammars not well-represented in the LLM’s training dataset and performance variations depending on the choice of visualization libraries and code generation capabilities, LIDA remains a powerful tool for automating the visualization generation process, saving time and effort for data analysts and researchers.
LIDA Read More »

Delineate

Delineate

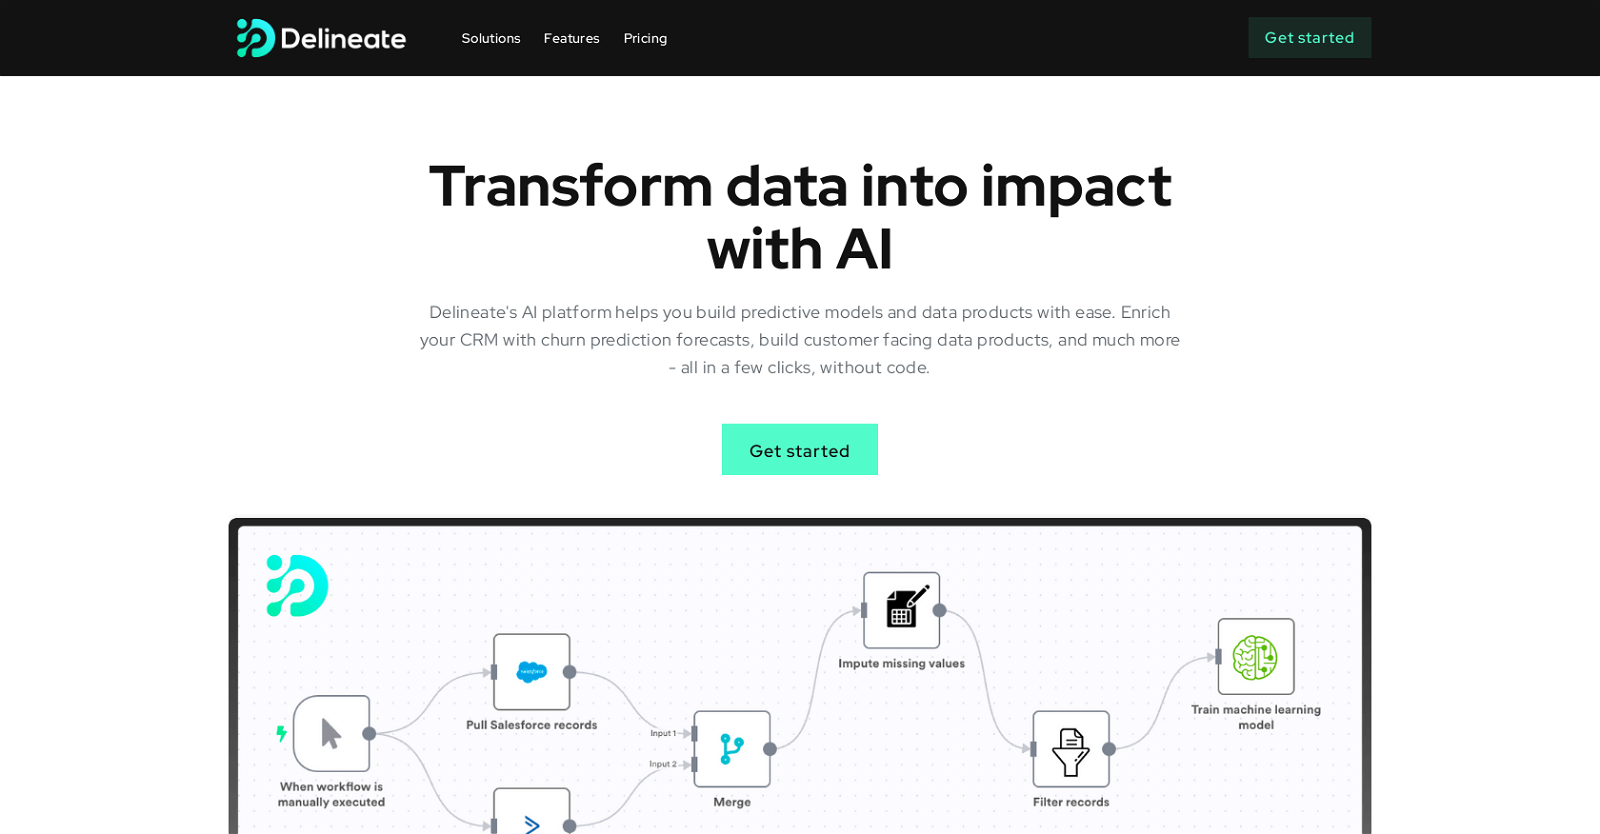
Delineate is an AI and predictive analytics tool that empowers users to unleash the potential of their data. With its user-friendly interface, users can effortlessly build predictive models and data products, even without coding skills. This versatile platform caters to various teams, including sales and marketing, data and analytics, and product teams, enabling them to transform their data into valuable insights and make informed decisions.

One of the key features of Delineate is its drag and drop workflow builder, which allows users to quickly create ETL pipelines. This functionality makes data actionable with just a few clicks, saving time and effort. Additionally, Delineate provides a range of tools such as dashboards, business intelligence tools, and report generation capabilities, facilitating the visualization of collected data.

Delineate is highly adaptable and integrates seamlessly with popular databases, CRM systems, and platforms, ensuring smooth data input and output. With hundreds of integrations available, users can easily connect their data sources and leverage the platform’s capabilities.

To cater to different needs, Delineate offers flexible billing options, including monthly and annual plans with no lock-in contracts. Users have the freedom to cancel their subscription at any time. Moreover, the tool provides a free 14-day trial period for all plans, allowing users to explore its features before committing.

Data security is a top priority for Delineate. The platform adheres to the latest enterprise-grade best practices to safeguard user data, ensuring the utmost protection and confidentiality.

In summary, Delineate is an AI-driven tool that empowers users to unlock the potential of their data. With its intuitive interface, extensive integrations, and flexible billing options, it caters to various teams and enables them to build predictive models, create data products, and make data-driven decisions with ease.

Delineate Read More »

NextBI

NextBI

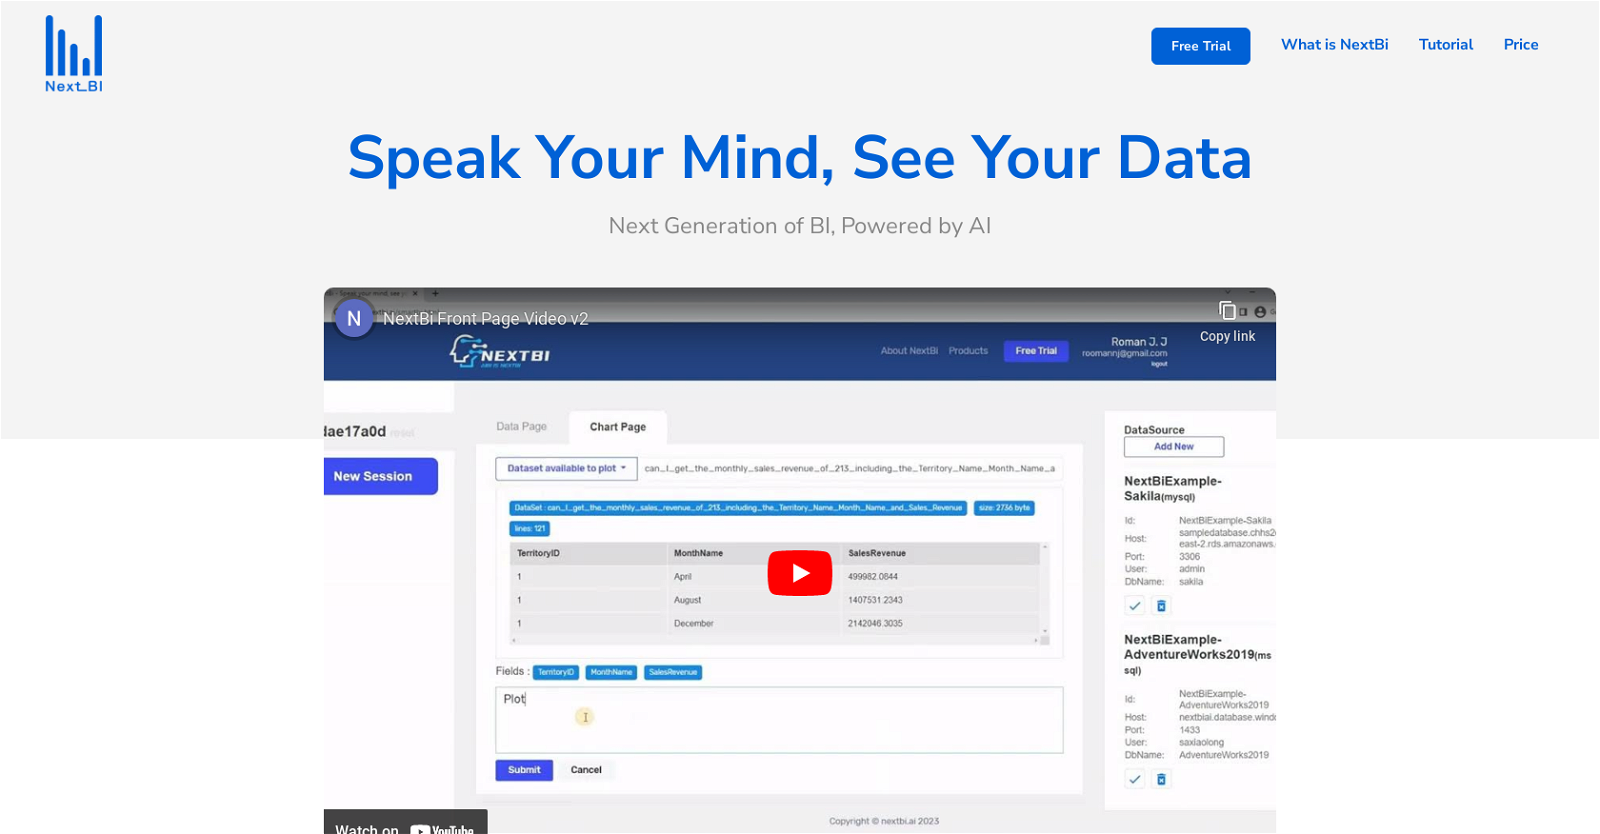
NextBi is a business intelligence (BI) tool that provides an accessible and user-friendly solution for BI reporting and visualization. It is powered by an AI engine that enables end-users to interact with databases without requiring technical expertise or SQL knowledge.

With NextBi, users can collect data by using natural language queries and generate reports within a few minutes. Additionally, the tool also allows users to choose their preferred visualization chart type using plain English, such as pie charts, bar charts, and line graphs.

NextBi is designed to be customizable, and the tool can adapt for modern startups’ needs. It offers a free trial version with limited features and an online experience edition that comes with a monthly subscription cost. NextBi offers an affordable option compared to other BI tools in the market.

Users can choose from the extended license or customized versions that provide additional levels of support and functionality. Overall, NextBi aims to make BI accessible, intuitive, and user-friendly for everyone. It enables businesses to explore their data and gain valuable insights effortlessly. With natural language processing, querying, and visualization, NextBi makes database interaction and analysis more intuitive and easy.

NextBI Read More »

Mnemonic

Mnemonic

Mnemonic AI is a powerful customer intelligence tool that leverages AI technology to help businesses gain a deeper understanding of their customers and meet their needs more effectively. By utilizing deep neural networks, Mnemonic AI decodes customer preferences and behaviors, generating AI-generated buyer and brand personas that eliminate guesswork and biases. This tool offers a range of features including buyer persona creation, customer personality analysis, and brand personality analysis, enabling businesses to create targeted marketing campaigns and personalized outreach for improved ROI, increased retention, and enhanced customer satisfaction.

One of the key strengths of Mnemonic AI is its source-agnostic system, which seamlessly connects to various data sources such as web analytics, surveys, interviews, email, call-logs, and publicly available data. By analyzing this diverse range of data, the AI provides valuable recommendations on how to personalize content for different channels, segments, and personas. This comprehensive approach ensures that businesses have access to next-generation customer intelligence, empowering them to infuse fun and creativity back into their marketing efforts.

Mnemonic AI has already been adopted by numerous brands seeking to enhance their relevance and engagement with customers. The AI-generated personas and personality analysis provided by Mnemonic AI have proven instrumental in increasing customer insights and delivering results efficiently, even within tight deadlines. With its headquarters in Austin, Texas, Mnemonic AI offers a demo for businesses interested in exploring the capabilities of this innovative tool.

Mnemonic Read More »

ChatAible

ChatAible

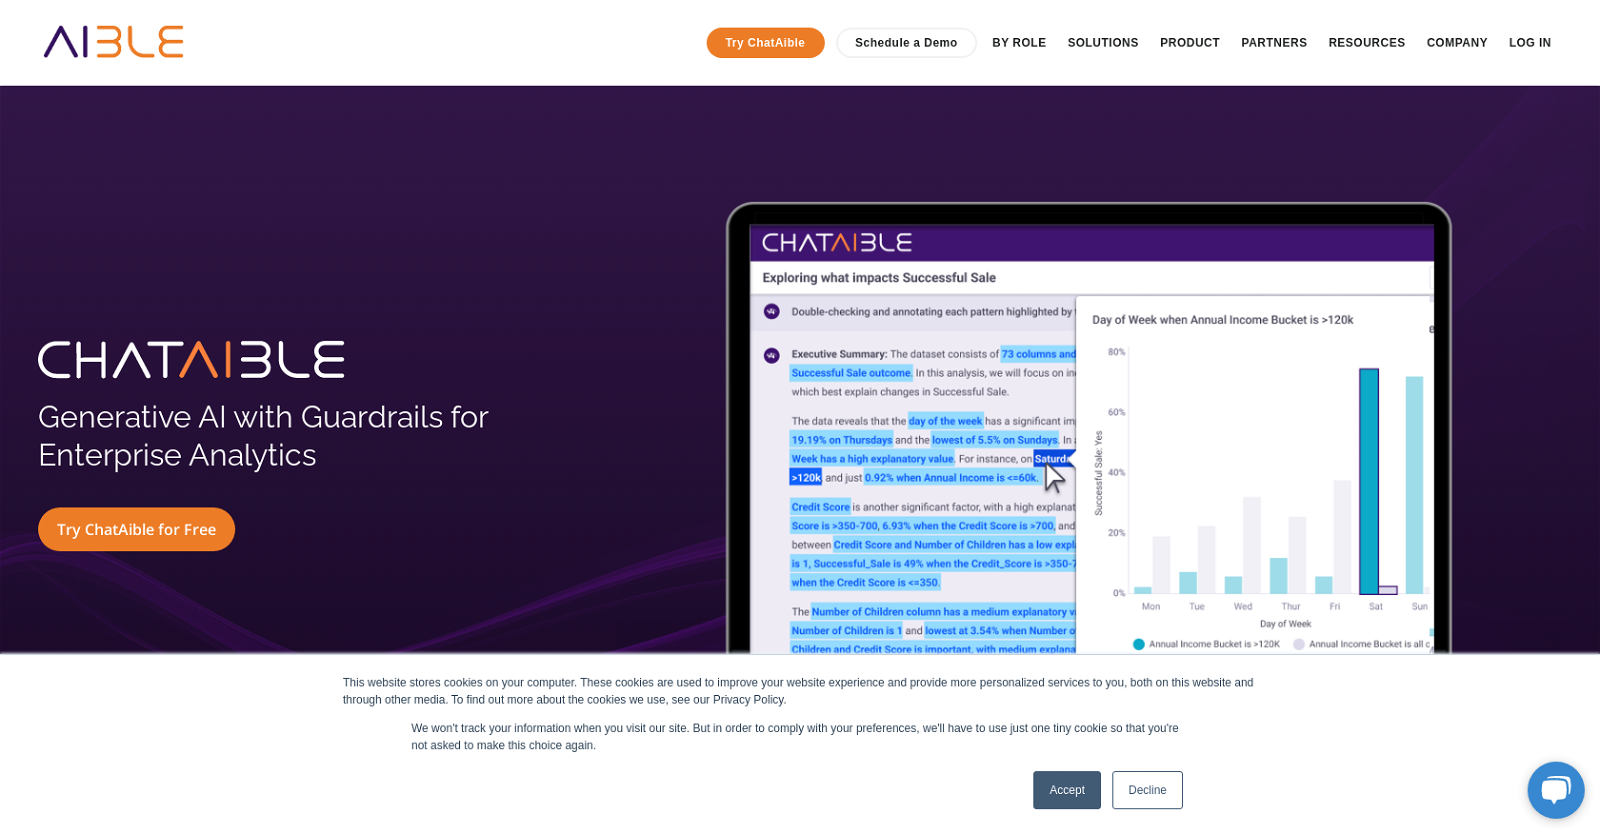
ChatAible is an AI tool that leverages explainable AI to ask millions of questions of data and find key insights. It then uses generative AI to summarize and double-check those insights in a way that is easily consumable by business executives.

The tool is validated by Fortune 100 companies such as UnitedHealthcare, Cisco, and NYC Health Hospitals who have reported finding hidden insights in a matter of minutes and using Aible to optimize their business operations.

The website stores cookies to provide a personalized experience, but it states that it won’t track user information. To comply with user preferences, the site uses a single cookie to remember previous choices. The website also provides a range of resources including case studies, marketing solutions, e-books, product and partner information, webinars, videos, whitepapers, and more.

ChatAible is marketed towards a range of roles such as Chief Data Officer, Business Manager, Data Scientist, Data Engineer, Business Analyst, and End User. The tool is useful for a range of industries such as Marketing, Supply Chain, Higher Education, Sales, e-Commerce, and Customer Service.

Overall, ChatAible is an AI tool that provides valuable insights for businesses of all sizes.

ChatAible Read More »